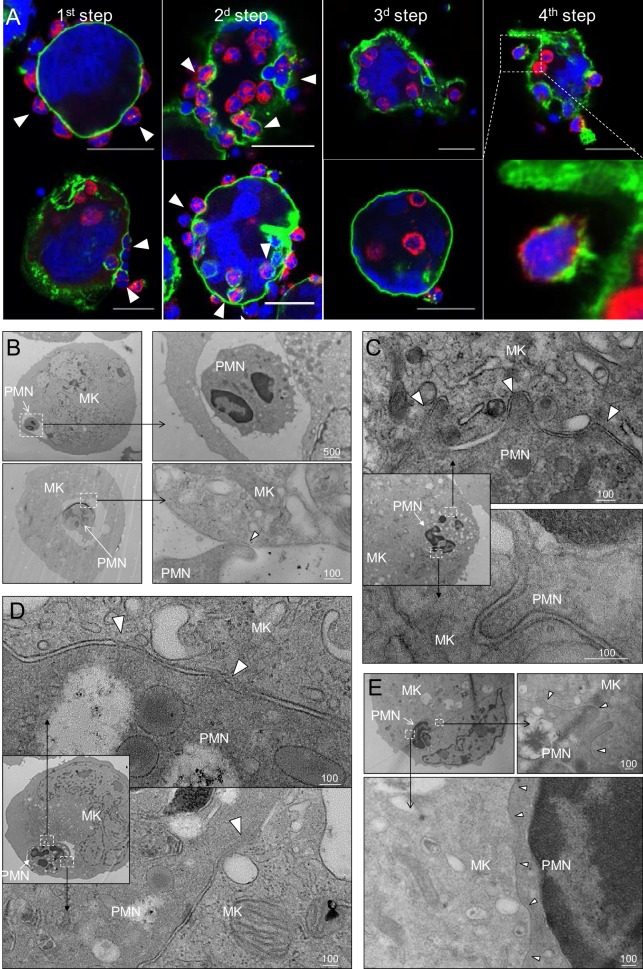
Figure 2. In vitro modeling of emperipolesis reveals a rapid multi-stage process.
(A) Confocal images showing different steps of emperipolesis. Green: CD41, Red: CD18, Blue: DNA. Scale bars represent 20μm. (B-E) Cells were stained with OsO4 after emperipolesis assay for electron microscopy observation. (B) Neutrophils inside MK vacuoles. Some neutrophil surface protrusions make contact with the emperisome membrane (arrowhead). (C-D) Close interaction between neutrophil and emperisome membrane forming a two-membrane leaflet structure. (C) Protrusions from neutrophils that extend inside the MK cytoplasm (arrowheads). (D) Demarcation between emperisome membrane and neutrophil membrane disappears (arrowheads). (E) Neutrophil and MK are separated by a single membrane (arrowheads). (B-E) Scale bars in nm, representative of at least 3 independent experiments.

