Figure 3. Depolymerization of actin filaments disrupts MPS and induces pro-degenerative signals.
20 µM of latrunculin A (LatA) or vehicle was applied to relevant DRG cultures (7 DIV) for 3 hr in the presence of NGF. (A, B) Representative 3D STORM images of βII-spectrin in axonal regions in untreated (left), LatA-treated (middle), 12-hr recovery (cultured for an extra 12 hr after LatA removal, right) cultures are shown in (A) and quantified in (B). Scale bar: 1 µm. Statistics: Data are represented as mean ± SEM. Axon number: 27–36 per condition. ***p≤0.001. p-Values are derived from a two-sided Kolmogorov-Smirnov test. The individual values of MPS autocorrelation amplitudes are listed in Figure 3—source data 1. (C) 7 DIV DRG cultures were subjected to 6 hr TD or 6 hr treatment with 20 µM LatA, either alone or in the presence of 1 μM DLK inhibitor (DLKi) GNE-3511. Cultures were stained with the DNA dye Hoechst 33342 (blue) and an antibody to phosphorylated c-Jun (Serine 73) (p-c-Jun) (red). Cell bodies are visualized. Scale bar: 50 µm. (D) Quantification of the fraction of phosphorylated c-Jun positive cell bodies in (C). Data are represented as mean ± SEM. N = 3 independent experiments. *p≤0.05, ***p≤0.001, two-way ANOVA with Bonferroni post-test. The individual values of the fraction of phosphorylated c-Jun positive cell bodies are listed in Figure 3—source data 2. (E) Cultures of WT DRGs were established that expressed lentiviral cytoplasmic NMNAT1. A subset of axons were physically severed from their cell bodies (isolated axons, locate at the lower half of each field of view and are encircled with a dotted red line) while the rest of axons (intact axons, upper left of each field of view) remain connected to cell bodies, followed by either 12 hr TD (left) or 12 hr application of 20 µM LatA. Cultures were stained for cleaved Caspase-3 (top) to indicated Caspase-3 activity and βIII tubulin (TuJ1, bottom) to indicate axons. Scale bar: 100 µm. (F) In parallel cultures with (E), at 8 DIV, axons were either severed away from their cell bodies (‘isolated axons’) or left intact (‘intact axons’) and subjected to 16 hr of TD or 16 hr treatment with 20 μM LatA in the presence of NGF. At the end of the assay (16 hr time point), cell bodies were removed from the ‘intact axons,’ leaving all cultures with axons but no cell bodies. At the point, axonal DEVDase activity was measured. Data are represented as mean ± SEM. N = 3 independent experiments. ***p≤0.001, two-way ANOVA with Bonferroni post-test. The individual values of axonal DEVDase activities are listed in Figure 3—source data 3.

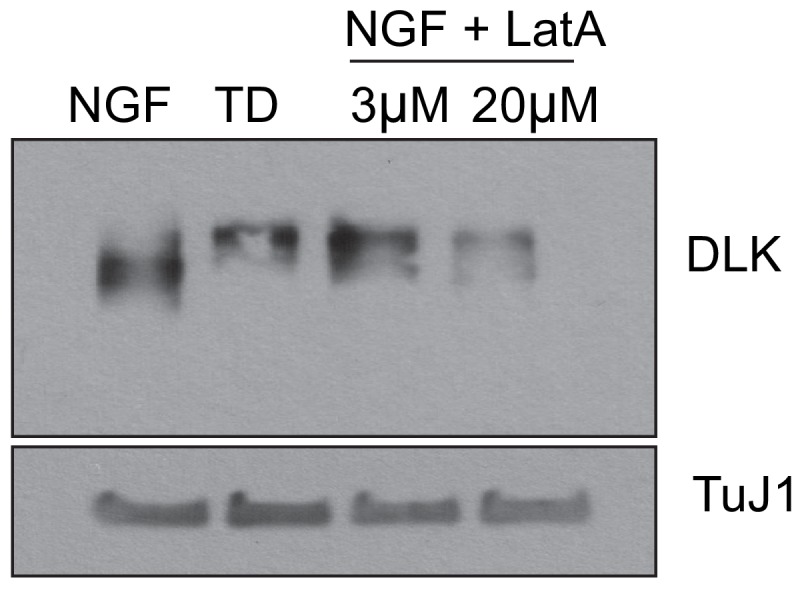
Figure 3—figure supplement 1. Latrunculin A treatment induces activation of DLK mimicking TD.