Fig. 1.
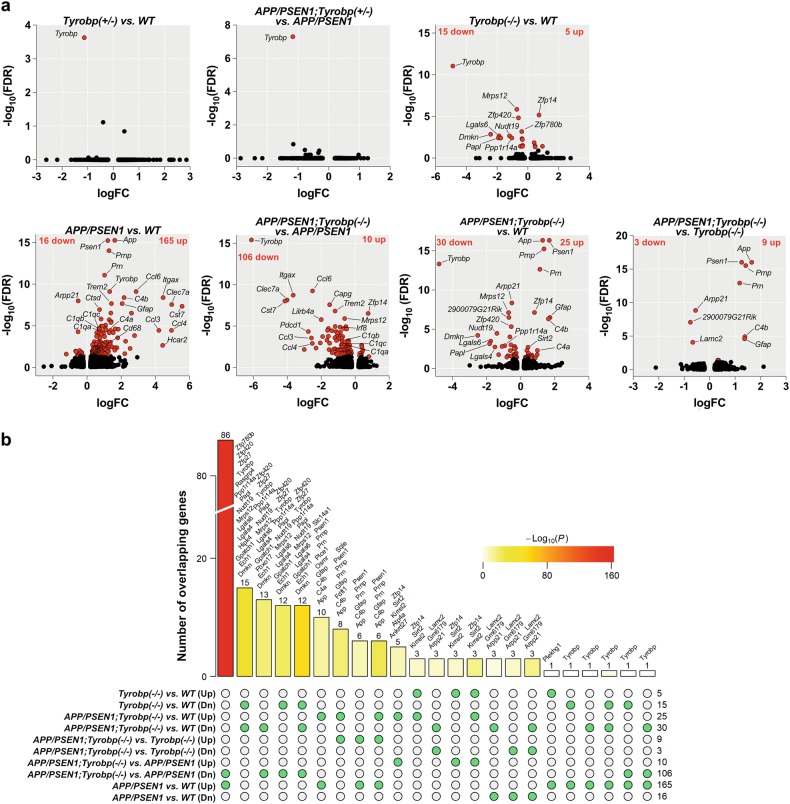
RNA sequencing and differentially expressed genes (DEGs) in mice. The absence of TYROBP downregulated half of the genes upregulated in APP/PSEN1 mice vs. WT. RNA sequencing was performed on the prefrontal cortex for six groups of mice at 8-month -old of age (WT (n = 4), Tyrobp+/− (n = 3), Tyrobp−/− (n = 4), APP/PSEN1 (n = 4), APP/PSEN1;Tyrobp+/− (n = 4), and APP/PSEN1;Tyrobp−/− (n = 5)). a Volcano plot representations of the DEGs in WT and APP/PSEN1 mice heterozygous, knockout or WT for Tyrobp. Red dots represent DEGs at an FDR of 0.05. b Comparison of the shared and unique DEGs (FDR < 0.05) in APP/PSEN1, APP/PSEN1;Tyrobp−/− and Tyrobp−/− mice. The bar height denotes the number of DEGs overlapping in a given comparison as specified by the green circles underneath. The p value denotes the significance of the overlap size. List of overlapping DEGs are shown above the bars except for the comparison between APP/PSEN1;Tyrobp−/− vs. APP/PSEN1 (Dn) and APP/PSEN1;Tyrobp−/− vs. WT (see Suppl. Figure 3c). Up upregulated; Dn downregulated genes

