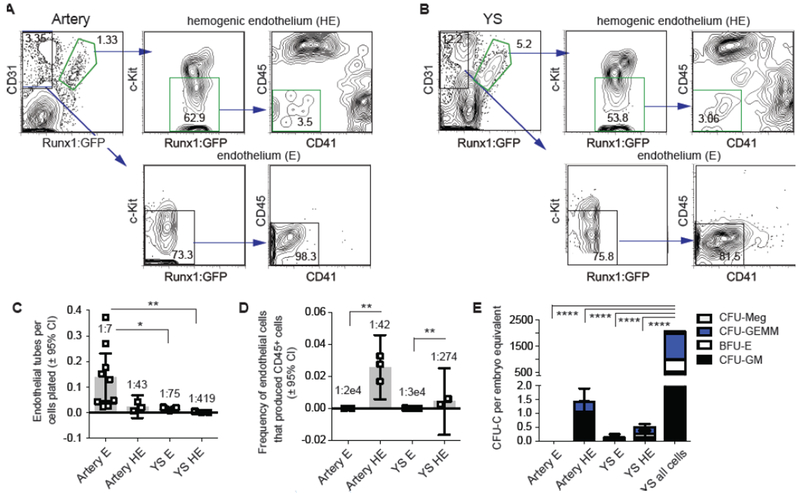
Figure 1. Isolation and functional characterization of hemogenic endothelial (HE) and endothelial (E) cells from the arteries and yolk sac.
A) FACS gating strategy to purify HE and E cells from the arteries. Shown are profiles from E10.5 embryos.
B) Purification of HE and E from yolk sacs (YS), E10.5.
C) Frequency of cells that produced endothelial tubes on OP9 cells cultured with vascular endothelial growth factor (VEGF). Data from E10.5 HE and E are shown. Average frequencies are indicated above the bars. Significance determined by ANOVA and Tukey’s multiple comparisons test (mean ± 95% CI, *P < 0.05, **P < 0.01, n=3 experiments).
D) Frequency of HE and E cells that produced CD45+ hematopoietic cells following 8–10 days of culture on OP9 stromal cells in the presence of stem cell factor (SCF), interleukin 3 (IL-3), FLT3 ligand (Flt3L) and IL-7. Data from E10.5 HE and E are shown. Significance determined by ANOVA and Tukey’s multiple comparison tests (mean ± 95% CI, **P < 0.01, n=3 experiments).
E) Methylcellulose assays to enumerate colony forming units - culture (CFU-C) in sorted populations of endothelial cells, and unfractionated yolk sac cells as a control, represented as the number of CFU-Cs per embryo equivalent. Data from E10.5 samples shown. Significance determined by ANOVA and Tukey’s multiple comparison tests (mean ± SD, P < 0.0001, n = 4–8 samples, data combined from 3 experiments).

