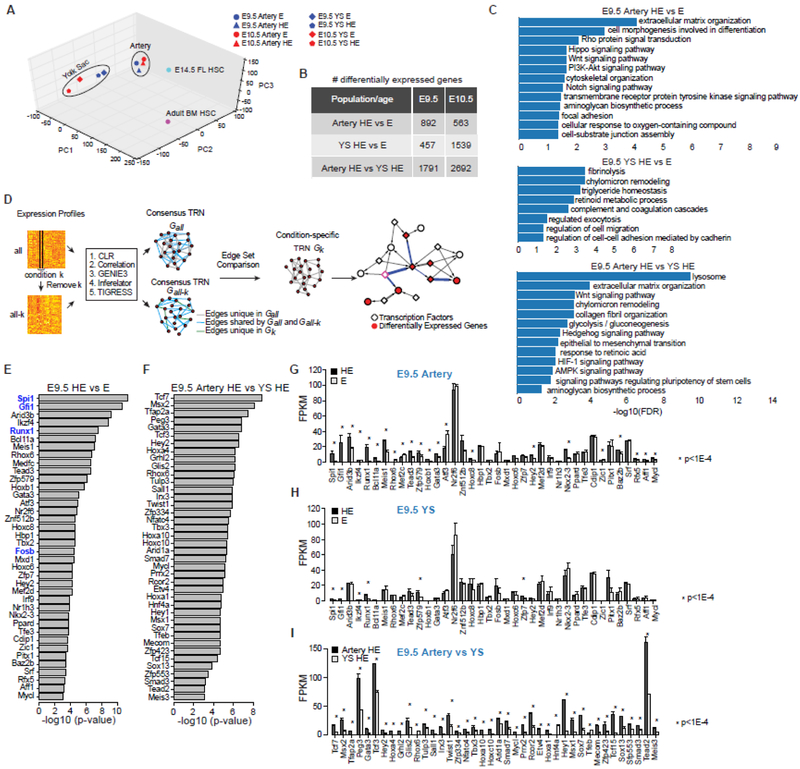
Figure 2. Global comparison of the transcriptomes of HE and E.
A) Principle component analysis of the transcriptome data. Also shown are fetal liver (FL) HSCs and adult bone marrow (BM) HSCs for comparison. The t-distributed stochastic neighbor embedding (t-SNE) algorithm [98] yielded the same result (not shown).
B) Number of differentially expressed genes based on pairwise comparisons (false discovery rate of 0.05 and fold change of 1.5).
C) Enriched pathways among differentially expressed genes from each pairwise comparison of E9.5 HE and E (false discovery rate of 0.05).
D) A novel computational framework for condition-specific transcriptional regulatory network (TRN) construction and identification of key transcription factors. Nodes in the TRN represent genes, and edges represent regulatory relationship between TFs and target genes. The framework first constructs a consensus TRN for each cell type by using five methods, CLR (the context likelihood of relatedness) [99], a method based on Pearson correlation [99], GENIE3 (gene network inference with ensemble of trees) [100], Inferelator [101], and TIGRESS (trustful inference of gene regulation using stability selection) [102]. Next, the framework prioritizes key TFs based on their potentials of regulating the entire set of differentially expressed genes between the two TRNs compared. Details are provided in the Supplemental Methods.
E) Prioritized key TFs for E9.5 HE (artery HE plus YS HE) versus E (artery plus YS E). Shown in blue are the four TFs used by Sandler et al. and Lis et al. to convert endothelial cells into blood cells [82, 83]. Analysis of comparable E10.5 samples also prioritized Pitx1, Spi1, Runx1, Tead3, Rhox6, Tbx2, Hox8, Hbp1, Mxd1, Znf512B, and Hoxc8 (not shown).
F) Prioritized key TFs for E9.5 artery versus YS HE. TFs prioritized in both E9.5 and E10.5 artery versus YS HE include Tead2, Zfp423, Mecom, Sox7, Msx1, Etv4, Rcor2, Mycl, Tbx3, Twist1, Rhox6, Hoxa4, Tcf3, and Tcf7 (not shown).
G–I) Expression levels of prioritized TFs in corresponding comparisons of E9.5 HE and E. FPKM, Fragments Per Kilobase of transcript per Million mapped reads.

