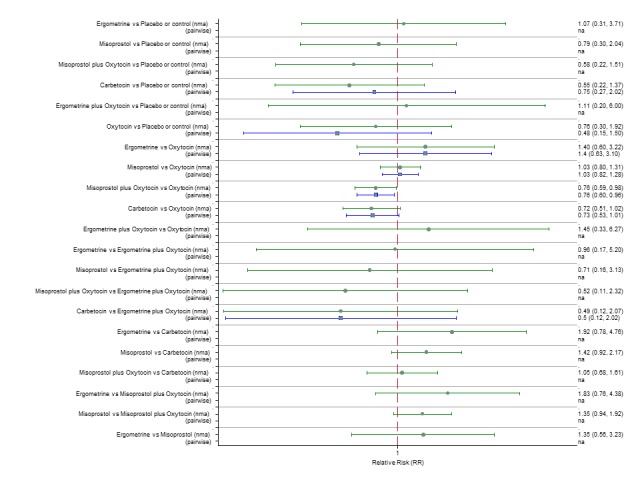
Figure 54.

Forest plot with relative risk ratios and 95% CIs from network meta‐analysis and pairwise analyses for prevention of PPH ≥ 500 mL by prior risk for PPH (high risk).

Forest plot with relative risk ratios and 95% CIs from network meta‐analysis and pairwise analyses for prevention of PPH ≥ 500 mL by prior risk for PPH (high risk).