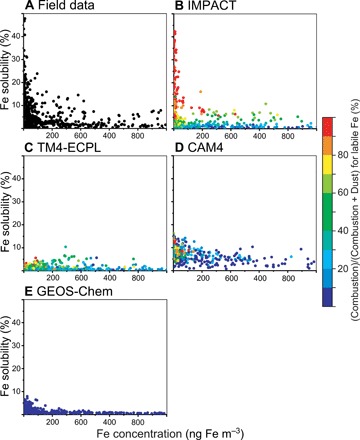
Fig. 1. Atmospheric concentration of total aerosol Fe (ng m−3) versus Fe solubility (%) for simulated estimates (colored circles) and field data (black circles).

(A to E) The color represents the (combustion)/(combustion + dust) ratio for labile Fe concentration in aerosols.
