
Figure 4.
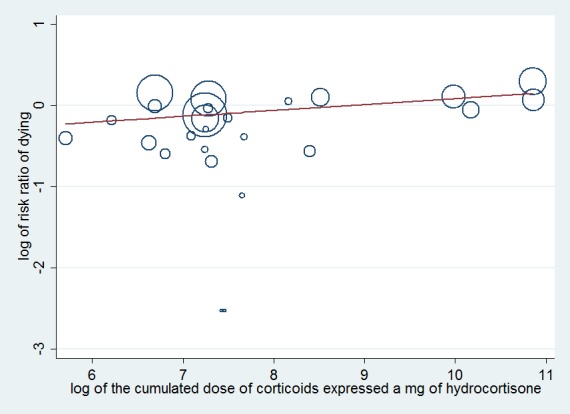
Figure represents results from meta‐regression of log of risk ratio of dying and log of cumulated dose of corticosteroids expressed as equivalent mg of hydrocortisone. Estimates from each study are represented by circles. Circle sizes depend on the precision of each estimate (the inverse of its within‐study variance), which is the weight given to each study in the fixed‐effect model.
Meta‐regression included 26 trials. The trial by Schummer et al was not included.
REML estimate of between‐study variance tau2 = .01183 % residual variation due to heterogeneity I2 res = 6.99% Proportion of between‐study variance explained Adj R2 = 2.49%