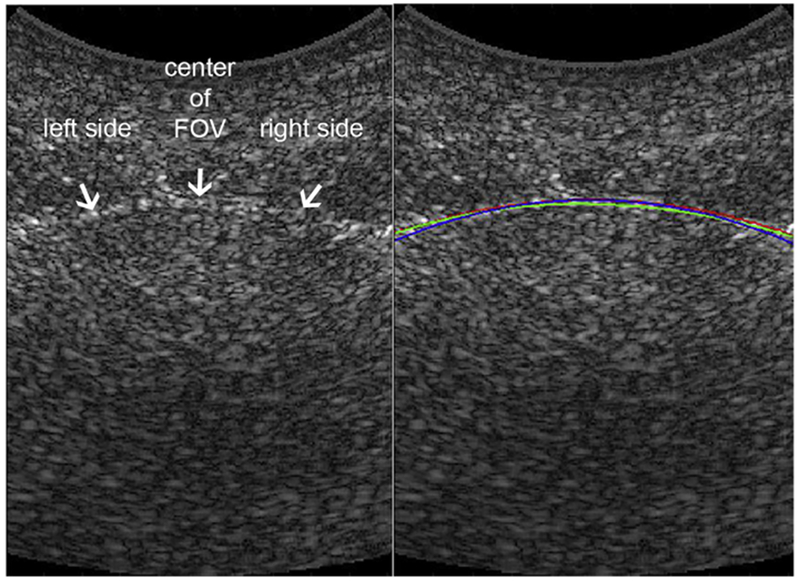
Fig. 2.

Tracking of bladder wall in B-mode image. Left: B-Mode image with arrows pointing to the bladder wall. Right: B-Mode image with color curves tracking bladder wall. Blue curve: Manual wall tracing (for Z.A.). Red curve: manual wall tracing (for M.C.). Green line: Automated dynamic programming tracking result. The ultrasound clutter inside the bladder is due to the system’s low signal-to-noise ratio. FOV = field of view.
