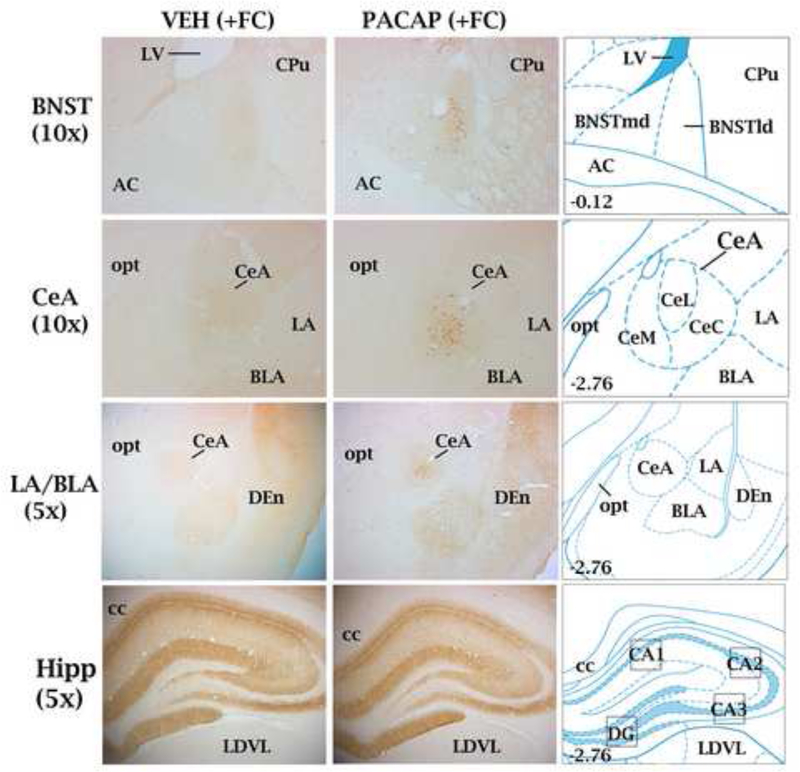
Figure 2.
Representative coronal sections at different magnifications through brain areas examined for Arc expression in animals that received either VEH (left column) or PACAP (1.5 μg; middle column) and were fear conditioned (+FC). Right column: brain atlas plates from the atlas of Paxinos and Watson (2004) showing the location of brain areas examined for Arc expression relative to other landmarks. For the bed nucleus of the stria terminalis (dosolateral division; BNSTld), central nucleus of the amygdala (CeA) and granule layer of the dentate gyrus Arc-positive cell bodies were counted; boxed areas on atlas plates represent areas where optical density measurements were used to quantify Arc expression. Brain section levels are indicated in millimeters posterior to bregma. Central amygdaloid nucleus, lateral subdivision (CeL); central amygdaloid nucleus, medial subdivision (CeM); central amygdaloid nucleus, capsular subdivision (CeC); lateral amygdala (LA); basolateral amygdala (BLA); hippocampus (Hipp); lateral ventricle (LV); caudate-putamen (CPu); anterior commissure (ac); optic tract (opt); dorsal endopiriform nucleus (Den); corpus calllosum (cc); laterodorsal thalamic nucleus, ventrolateral (LDVL).

