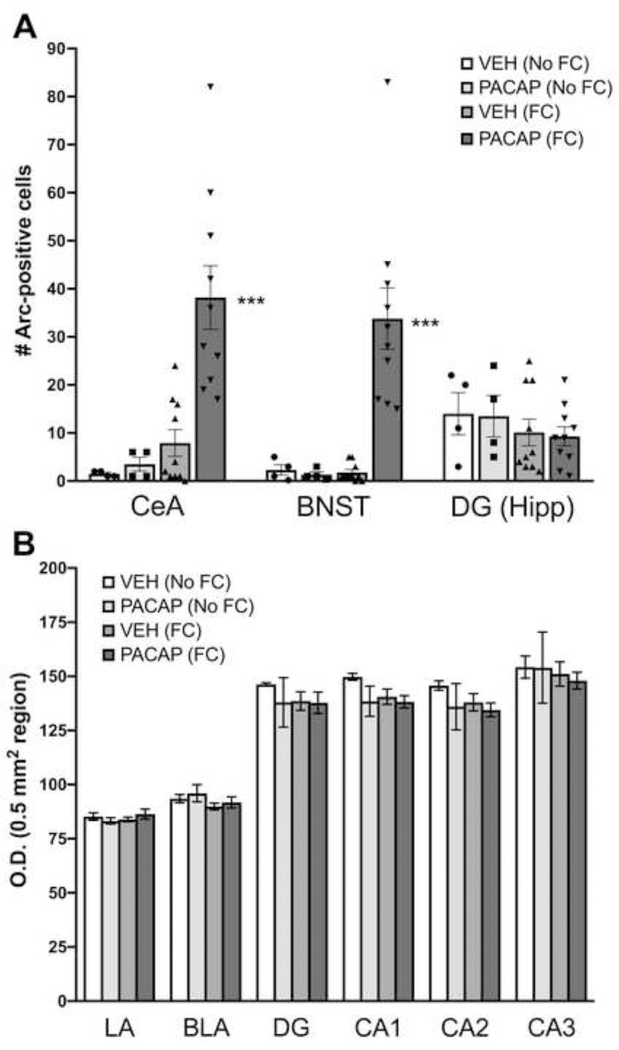
Figure 3.
Quantification of Arc Expression after PACAP treatment and fear conditioning. (A) Expression of Arc protein in cell bodies in the central nucleus of the amygdala (CeA), bed nucleus of the stria terminalis (BNST) or granule layer of the dentate gyrus (GrDG) of the hippocampus (Hipp) in animals that received either vehicle (VEH) or PACAP (1.5 μg) and were either fear conditioned (FC) or not (No FC). Individual data points for each treatment group are represented in scatter plots on the bar graphs (B) Expression of Arc protein measured by optical density (O.D.) in the lateral (LA), basolateral amygdala (BLA), dentate gyrus (DG) or CA1-CA3 subdivision of the dorsal hippocampus across treatment conditions. VEH (No FC), n=4; PACAP-No FC, n=4; VEH (FC), n=10; PACAP (FC), n=10. ***P<0.0005 compared to all other groups. Data are shown as mean±s.e.m.

