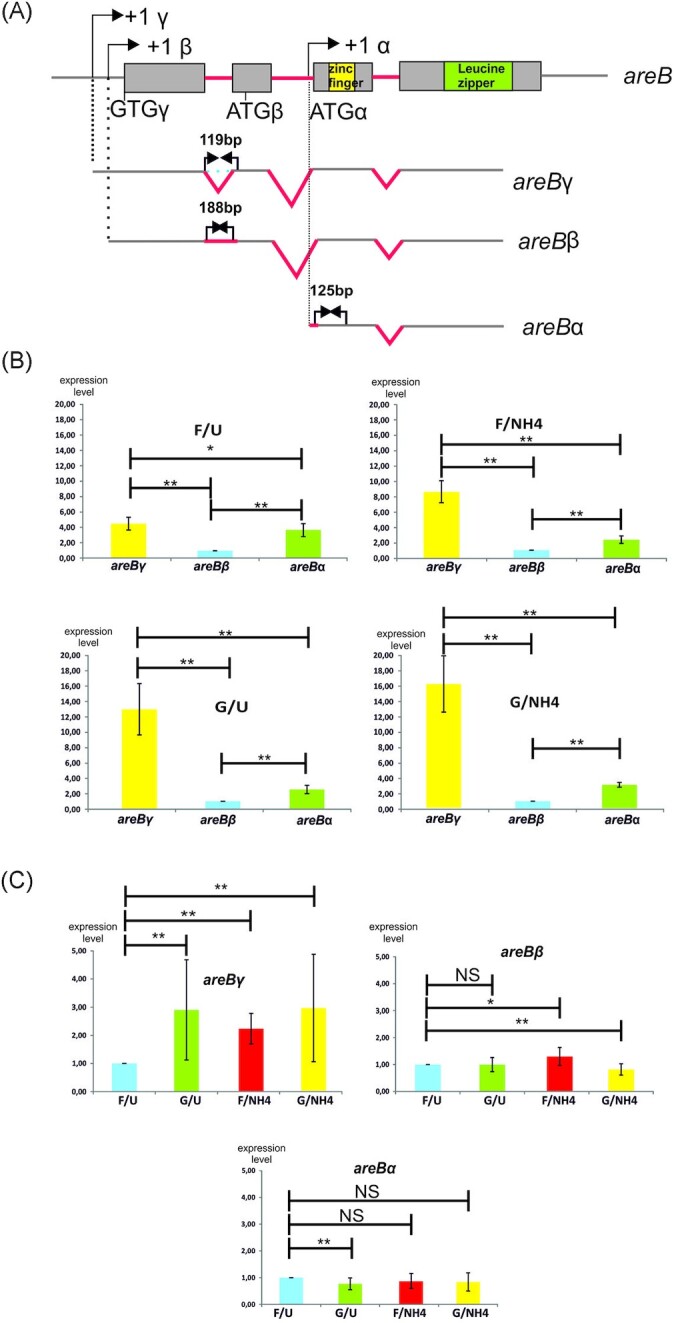
Figure 5.

Transcriptional analysis of the areB gene under different carbon and nitrogen regimes. (A), Structure of areB gene and its three transcripts (based on Conlon et al. 2001). Differential RT-qPCR analysis of areB transcripts was performed using primers specific for each mRNA. Introns are marked in red. Amplified fragments, specific for α, β or γ areB mRNA are marked with blue arrows. Left primer for areBγ mRNA amplification is complementary to exon—exon junction in the spliced transcript. (B), Comparison of expression levels of three areB transcripts in the wild type strain grown under specific carbon/nitrogen repressing and/or derepressing conditions. The level of areBβ mRNA was arbitrarily set to 1. *- P-value < 0.1; **- P-value < 0.05. (C), Comparison of expression levels of each specific areB transcript, in the wild type strain grown under different carbon/nitrogen repressing and/or derepressing conditions. The level of each mRNA under nitrogen and carbon de-repressing conditions (FU) was arbitrarily set to 1. *- P-value < 0.1; **- P-value < 0.05. NS—difference not significant.
