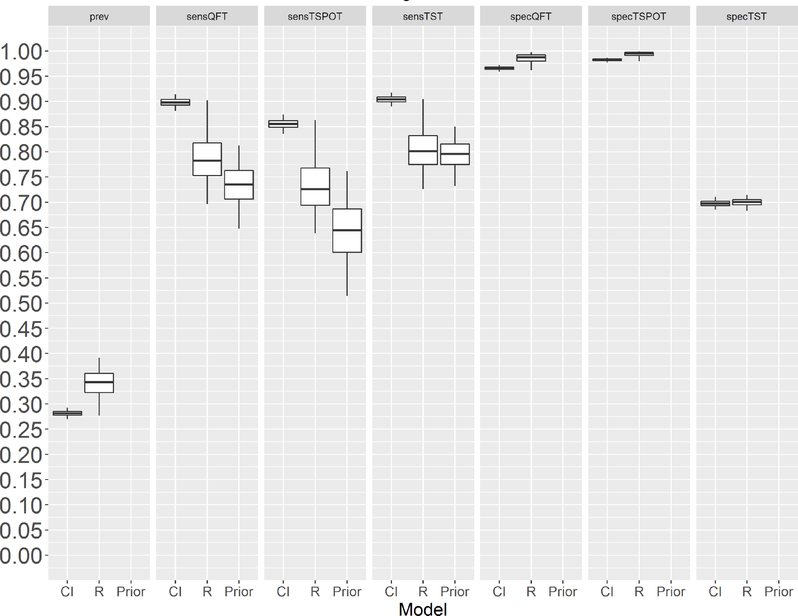
Figure 2.
Latent TB infection prevalence and test characteristics (sensitivity and specificity) for foreign-born, HIV-seronegative participants aged ≥5 years. On the x-axis, the label ‘CI’ stands for the model that assumes conditional independence of the tests; ‘R’ stands for the model that includes a random effect (to model conditional dependence between the tests); and ‘Prior’ indicates the scientific literature-based prior distribution (for test sensitivity only). The horizontal lines in the centre of the rectangles are the Bayesian posterior means, and the top and bottom lines in each box are the boundaries of the first and third quartiles, respectively. The tips of the vertical lines span the 95% credible interval for each parameter. For purposes of this analysis, TSPOT was evaluated by using the international criteria for a positive test (≥6 spots is positive; ≤5 spots is negative). CI, conditional independence model; Prev, latent TB prevalence; Prior, scientific literature-based prior distribution (for test sensitivity only); R, random effect model; sensQFT, sensitivity of QuantiFERON Gold In-Tube; sensTSPOT, sensitivity of T-SPOT.TB; sensTST, sensitivity of the tuberculin skin test; specQFT, specificity of QuantiFERON Gold In-Tube; specTSPOT, specificity of T-SPOT.TB; specTST, specificity of the tuberculin skin test.

