
Fig. 1: Control and Experimental PDGF concentrations in relation to model dose response curve.
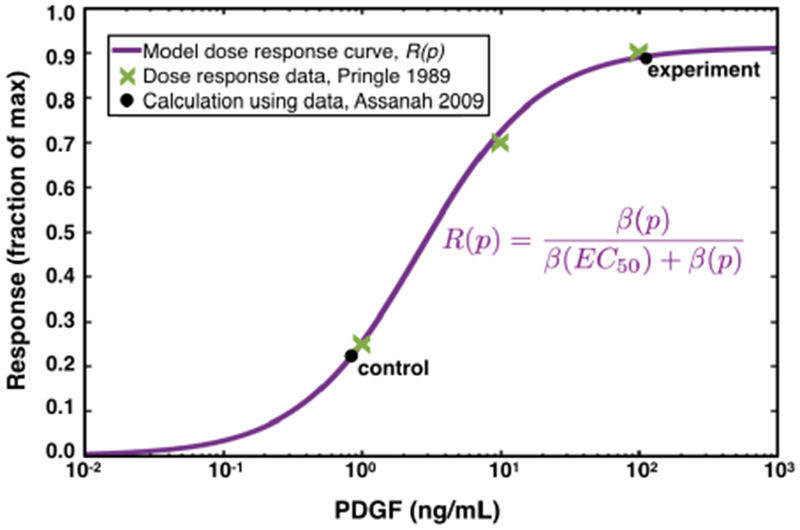
The model dose response curve is shown by the solid purple line, which fits the experimental dose response data from [46] shown by the green Xs. The PDGF concentration due to wounding (10) (which is computed in section 2.3.1), as well as that for the experiment with 100 ng/mL added exogenous PDGF is indicated by the black dots. Notice that the response level of the experiment is four-fold higher than that of the control, as found in [6].