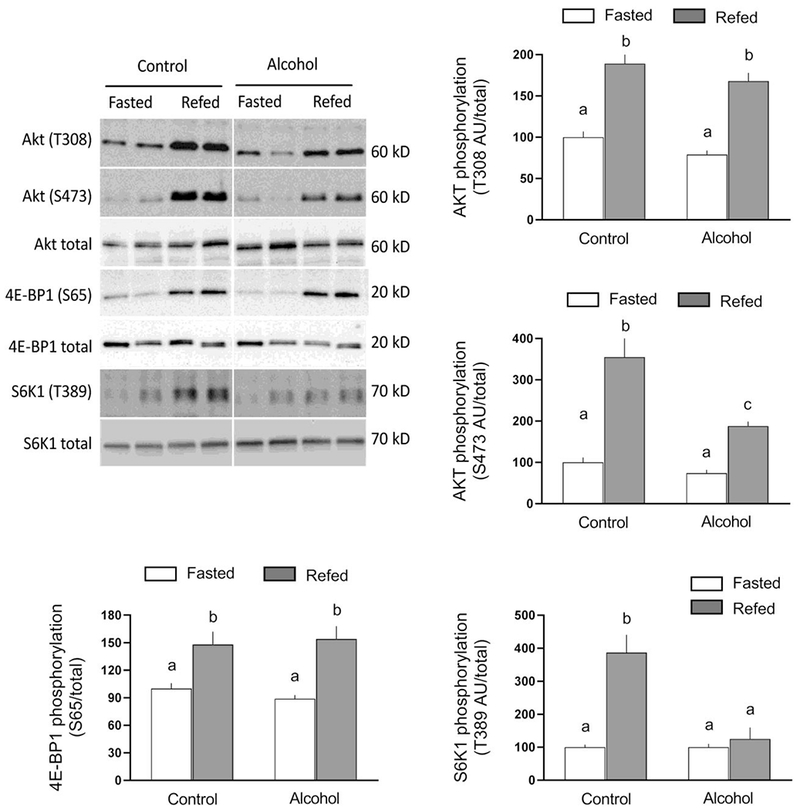
Fig 2.

Refeeding-induced changes in 4E binding protein-1 (4E-BP1), ribosomal S6 kinase (S6K)-1, and AKT phosphorylation in gastrocnemius/plantaris from saline-treated control and ethanol-treated mice. A representative Western blot for each protein of interest is shown in the top left panel. The approximate molecular weight in kD for the protein of interest is shown to the right of each blot. Samples from all four experimental groups were run on the same gel and the vertical white line indicates that intervening lanes of the gel have been removed for presentation purposes. Bar graphs represent densitometric analysis of all immunoblots, where the value from fasted saline-treated control mice was set at 100 AU. Values are means ± SEM; n=10, 10, 12 and 12, respectively. Different letters above bars (i.e., a vs b; a vs c; or b vs c) indicate that mean values are statistically different from each other (P<0.05), whereas group means having the same letter (i.e., a vs a; or b vs b) are not statistically different
