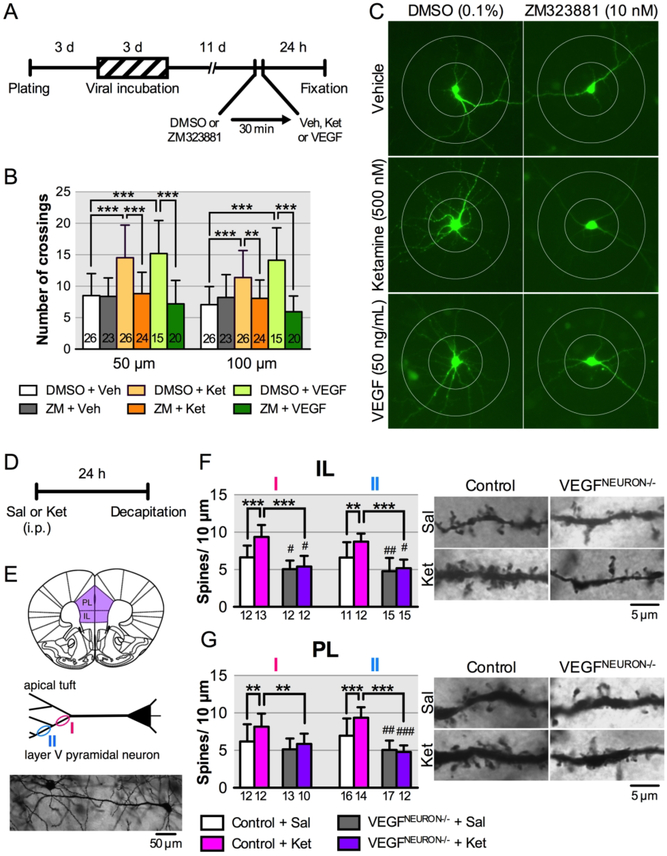
FIGURE 5. Effect of blockade of neuronal VEGF signaling on the neurotrophic and synaptogenic effects of ketaminea.
a(A) Experimental timeline for dendritic morphology in rat primary cultured cortical neurons. (B) The number of dendritic crossings at 50 and 100 μm distances from the soma after 24-h vehicle, ketamine (500 nM) or VEGF164 (50 ng/mL) treatment with 30-min pre-incubation of 0.1% DMSO with or without ZM323881 (10 nM; 50 μm, interaction, F2,128 = 11.0, p < 0.0001; 100 μm, interaction, F2,128 = 17.2, p < 0.0001, n = 15–26). (C) Representative images of EGFP-expressing rat primary cortical neurons from each group with concentric circles (100- and 200-μm diameter). (D) Experimental timeline for dendritic spine analysis. (E) Spine density was analyzed on primary (I) and secondary (II) branches of the apical tuft of layer V pyramidal neurons in the infralimbic (IL; n = 11–15 branches from 6 cells from 3 mice/group) and prelimbic (PL; n =10–17 branches from 6 cells from 3 mice/group) mPFC. Bottom, representative image of a Golgi-stained layer V pyramidal neuron. (F) Left, spine density of infralimbic pyramidal neurons (I, interaction, F1,45 = 8.45, p = 0.0056, n = 12–13; II, interaction, F1,49 = 4.06, p = 0.049, n = 11–15). Right, representative images of the apical tuft segments. (G) Left, spine density of prelimbic pyramidal neurons (I, interaction, F1,43 = 1.51, p = 0.23, main effect of ketamine, F1,43 = 6.72, p = 0.013, main effect of genotype, F1,43 = 10.6, p = 0.0022, n = 10–13; II, interaction, F1,55 = 10.2, p = 0.0023, n = 12–17). Right, representative images of the apical tuft segments. Data are expressed as means ± SD. **p < 0.01, ***p < 0.001; #p < 0.05, ##P < 0.01, ###P < 0.001 relative to Control+Sal mice.

