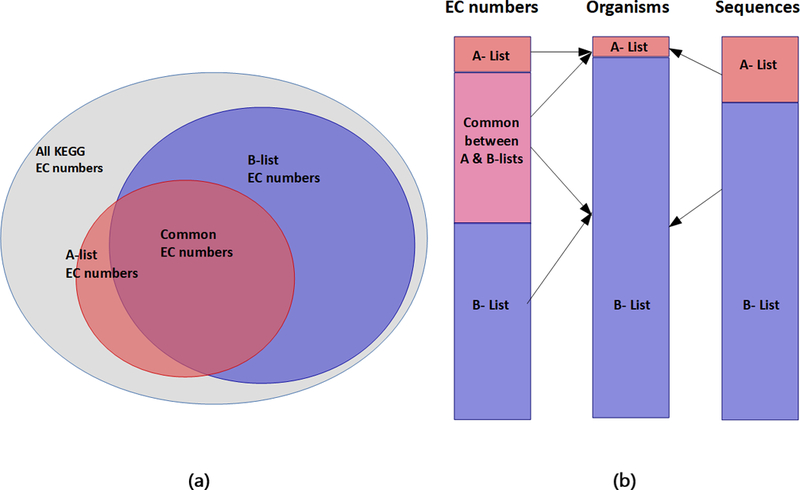
Figure 2:

Statistics related to ProSol DB. (a) Venn diagram showing sets of all EC numbers in KEGG (6,896), those covered by the A-list (2,427), and those covered by the B-list (4,350). The intersection between the A-list and the B-list consists of 2,125 EC numbers covering 46% of EC numbers available in ProSol DB. (b) Each stack shows information related to the A-list and B-list organisms. The first bar shows tally of EC numbers in A-list, B-list, and their intersection. The second bar shows that the A-list consists of 20 organisms, which is only 0.33% of the organism diversity yet covers 52% of all the EC numbers in the database. The third bar shows that 13% of all protein sequences in ProSol DB are covered by the A-list organisms. These statistics demonstrate that the number of verified enzyme sequences and EC numbers are overrepresented in the A-list, which comprises many model organisms.
