
Figure 3:
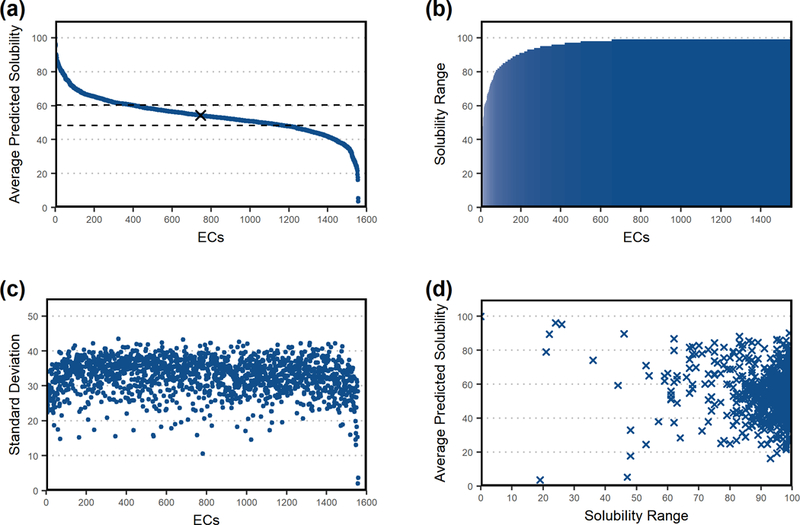
Correlation analysis between solubility confidence scores and EC numbers for enzymes with 10 or more sequences in ProSol DB. (a) Average solubility confidence scores for enzymes, sorted from highest to lowest average score. (b) Predicted solubility confidence score ranges for each enzyme, sorted from smallest to largest. (c) Standard deviation of solubility confidence scores for each enzyme, sorted as in panel (a). (d) Scatter plot of solubility confidence score ranges and average scores. There is low correlation between the score ranges and average solubility confidence scores as determined using Spearman’s Rank Test (Spearman’s rank coefficient = 0.00897).