Figure 5:

Predicted yields and corresponding lengths for pathways producing 3-hydroxypropanoic acid identified by ProPASS. Each point on the plot represents one pathway. The three orange triangles coincide with pathways reported in the literature.

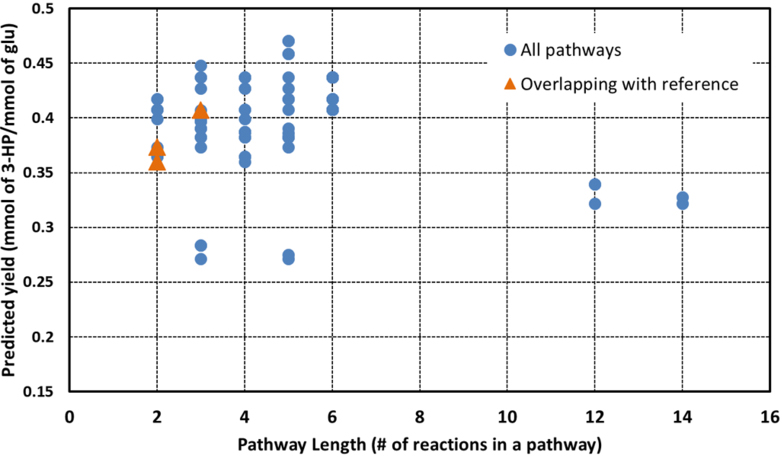
Predicted yields and corresponding lengths for pathways producing 3-hydroxypropanoic acid identified by ProPASS. Each point on the plot represents one pathway. The three orange triangles coincide with pathways reported in the literature.