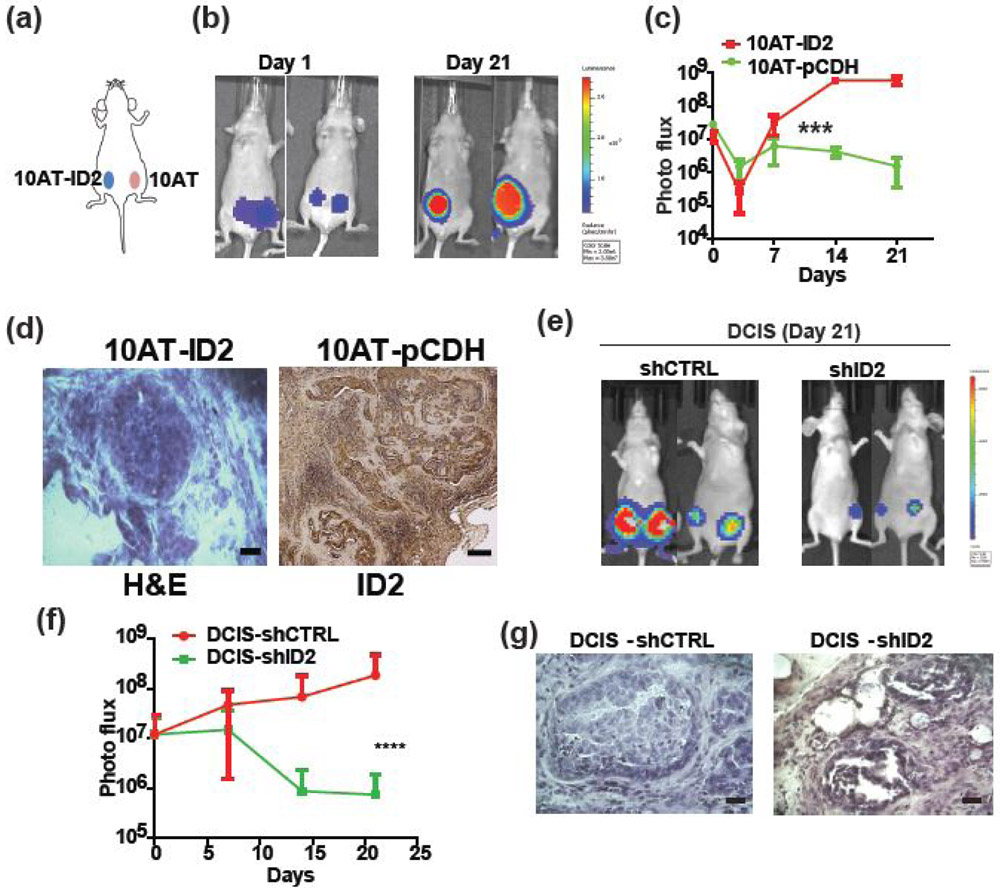
Figure 3. ID2 promotes DCIS formation in vivo.
(a) MCF10AT-ID2 and MCF10AT-pCDH (control) cells were implanted in the same mouse into the left and right side of the mammary fat pad, respectively (n = 10, left panel). (b) Tumor growth was monitored with the IVIS imaging system for up to 3 weeks. Representative IVIS images on day 1 and day 21 are shown in the right panels. The growth kinetics of tumor are shown in (c). (d) The tumors generated by MCF10AT-ID2 cells in nude mice were sectioned and H&E stained (left panel). Tumor formed by MCF10AT showed strong ID2 expression. Scale bar, 100μm. (e) DCIS-shCTRL and DCIS-shID2 cells were implanted into the mammary fat pad and monitored with the IVIS imaging system for 3 weeks. Representative images of tumor signal at day 21. (f) Growth kinetic of tumors. (g) The tumors generated by DCIS-shCTRL and DCIS-shID2 cells in nude mice were sectioned and H&E stained. Scale bar, 100μm.

