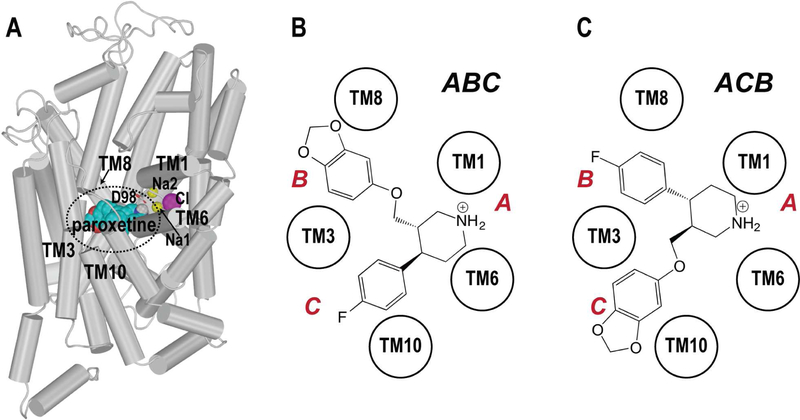
Figure 1.
The two binding poses of paroxetine in the S1 site of hSERT. (A) The equilibrated model from “WT/paroxetine-ABC” simulations (see text) is viewed parallel to the membrane normal in a cylindrical representation, with the S1 site enclosed by a black dotted circle. The schematic orientations of the ABC and ACB poses of paroxetine in the S1 site are illustrated in panels (B) and (C), respectively. The locations of subsites A, B, and C are labeled with red letters.

