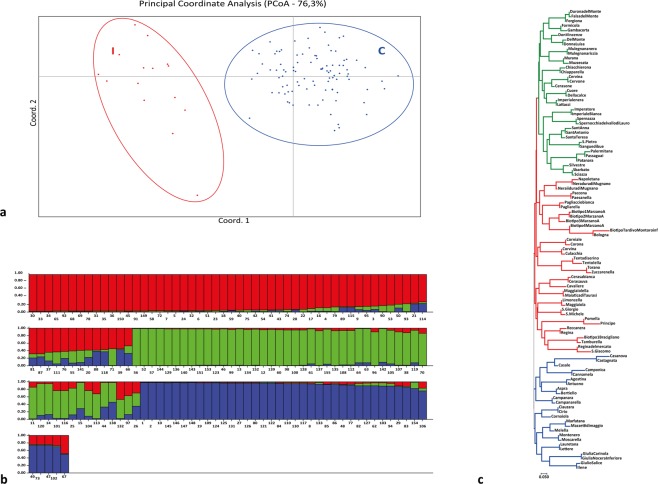
Figure 1.
Genetic analysis of Campania sweet cherry cultivars. (a) Principal Coordinate Analysis (PCoA) of Campania’s sweet cherry cultivars generated by the tri-distance matrix of genetic euclidean similarity (76.3% of representation); (b) The hierarchial STRUCTURE analysis identified three genetic clusters by assignment probability of the genotypes of the 99 Prunus avium accessions. Each vertical bar corresponds to a distinct genotype and the proportion of its genome, q, assigned to the three clusters. Accession numbers refer to the cultivars listed in Supplementary Table S2. (c) Genetic relationships of Campania sweet cherry cultivars. The dendrogram was inferred using the Neighbor-Joining method55 and constructed using MEGA v756. The optimal tree with the sum of branch length = 10.44 is shown.

