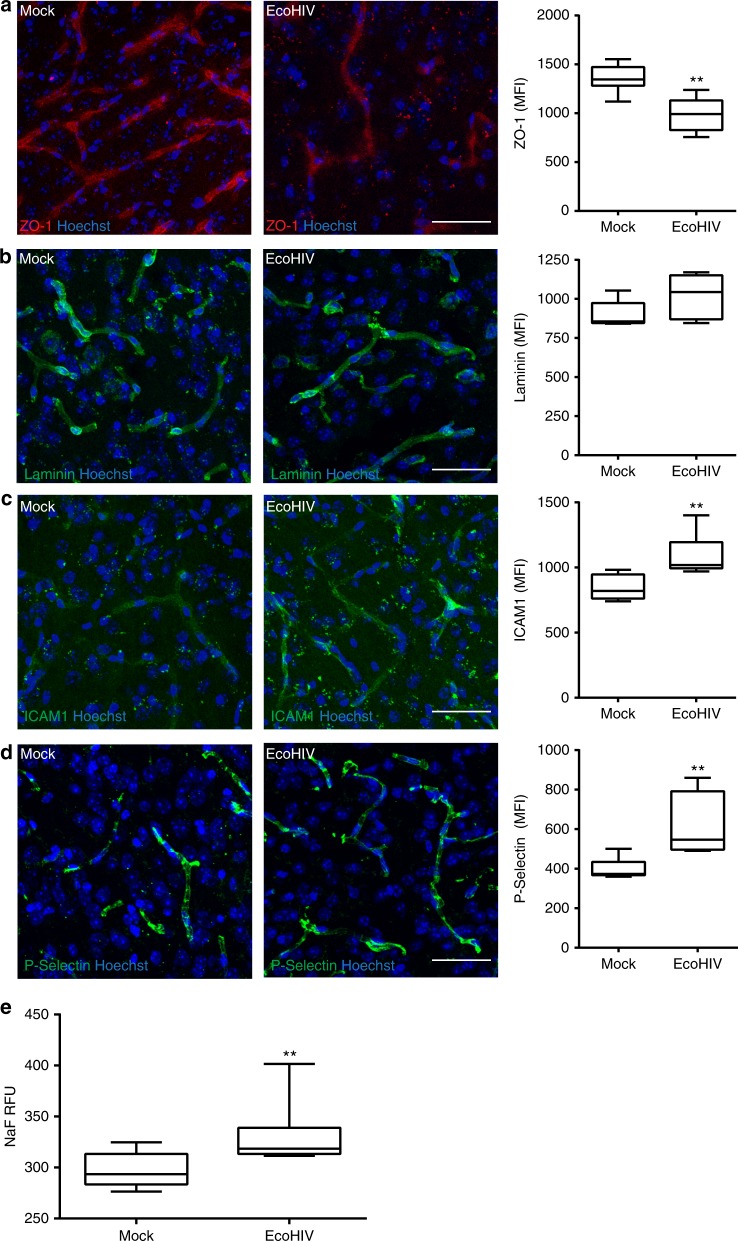
Fig. 2.
Disruption of NVU and inflammatory responses in EcoHIV-infected brains. Mice were infected as in Fig. 1, and analyses were performed 3 weeks post infection. Brain sections were stained for ZO-1 (a), laminin (b), ICAM-1 (c), and P-selectin (d). In a, b, n = 6 mice, 20 microvessels per mice, 2 independent experiments. In c, d, n = 6 mice per group, 10 microvessels per mice, 2 independent experiments. e BBB permeability in mock- and EcoHIV-infected mice as assessed by the sodium fluorescein (NaF) extravasation method; n = 10 per group, 2 independent experiments. Whiskers-box plots represent centerline median, with interquartile range and min-max whiskers. Source data are provided as a Source Data file. **p < 0.01 vs mock; unpaired t test. a–d Scale bars: 40 µm

