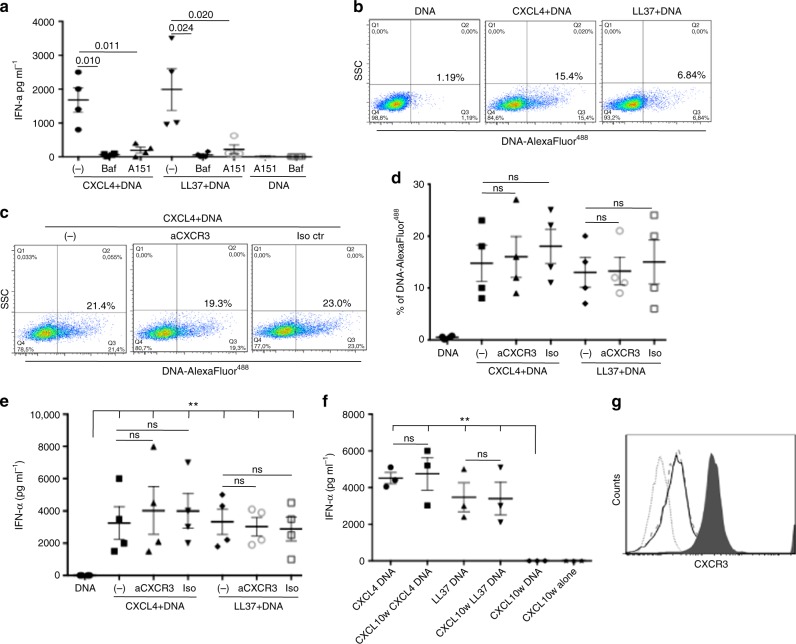
Fig. 5.
Activation of pDCs by CXCL4–DNA is TLR9-dependent and CXCR3-independent. a PDCs were stimulated with CXCL4 (1 μM)–DNA (10 μg ml−1) or LL37(10 μM)–DNA (10 μg ml−1) complexes in the presence/absence of bafilomycin A (Baf), an inhibitor of endosomal acidification, or A151, a specific inhibitor of TLR9. Horizontal bars represent the mean, vertical bars s.e.m. P-values by Student’s t test for paired samples (one-tailed). b pDCs were treated with CXCL4 (1 μM) or LL37 (10 μM) in complex with 10 μg ml−1 of AlexaFluor 488-conjugated huDNA, or with huDNA alone. DNA entry into pDCs was quantitated by flow cytometry. One representative experiment out of five was performed with huDNA or bacDNA. c pDCs were treated with CXCL4–huDNA complexes in the presence/absence of a blocking anti-CXCR3 or an isotype control antibody and analyzed by flow cytometry. d Cumulative data on huDNA/bacDNA uptake into pDCs quantitated for CXCL4–DNA complexes in the presence/absence of neutralizing anti-CXCR3 (10 μg ml−1) or isotype control antibody as in c. Horizontal bars are the mean, vertical bars s.e.m. Significance by Student’s t test for paired samples (two-tailed). e PDCs were stimulated (bacDNA at 10 µg ml−1) as indicated, in the presence/absence of the blocking anti-CXCR3 (10 µg ml−1) or isotype control antibody (10 µg ml−1) and IFN-α production was measured by ELISA after 24 h. Horizontal and vertical bars represent the mean and s.e.m., respectively. Significance by the Student’s t test for paired samples (two-tailed). f PDCs were pretreated with CXCL10 (10 µg ml−1) for 1 h, washed, and stimulated with CXCL4–bacDNA or LL37–bacDNA complexes. IFN-α production was measured by ELISA after 24 h. Horizontal and vertical bars represent the mean and s.e.m. P-values calculated by Student’s t test for paired samples (two-tailed). g PDC expression of CXCR3 by flow cytometry after no treatment (filled histogram) or 2 -h treatment (and after washing) with anti-CXCR3 blocking antibody (10 µg ml−1) (unfilled histogram) or with CXCL10 (10 µg ml−1) (unfilled dashed histogram). Flow cytometry isotype control is shown as light gray dotted histogram

