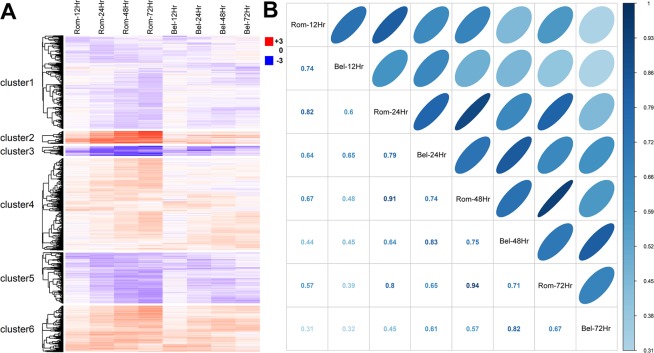
Figure 2.
(A) Differentially expressed probe sets (N = 6,540) were clustered hierarchically using Pearson correlation as a distance metric. (B) The correlation of average fold change between romidepsin and belinostat samples. The magnitude of the correlation coefficients is represented by the intensity of blue, dark being highly correlated, and by the shape of ellipses, with narrow being highly correlated. These panels show that rombidepsin and belinostat induced similar, directional changes in gene expression but the magnitude of the expression differential (relative to controls) was greater for romidepsin-treated embryos.

