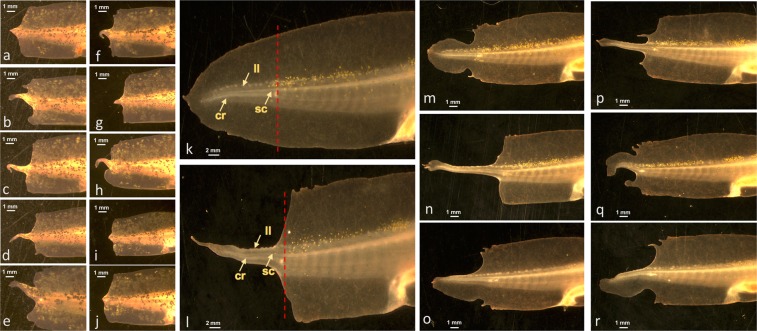
Figure 3.
Examples of tail regeneration at 21 dpa. (a–e) Individuals that were treated with 10 μM romidepsin for 3 hpa. (f–j) Individuals that were treated with 10 μm romidepsin for 24 hpa. (k) An individual that was not treated with romidepsin. The arrows indicate the spinal cord (sc), lateral line (ll), and cartilaginous rod in the tail regenerate. The red hatched-line shows the position of the amputation plane. (l–r) Individuals that were treated with 10 μm romidepsin for 1 mpa.

