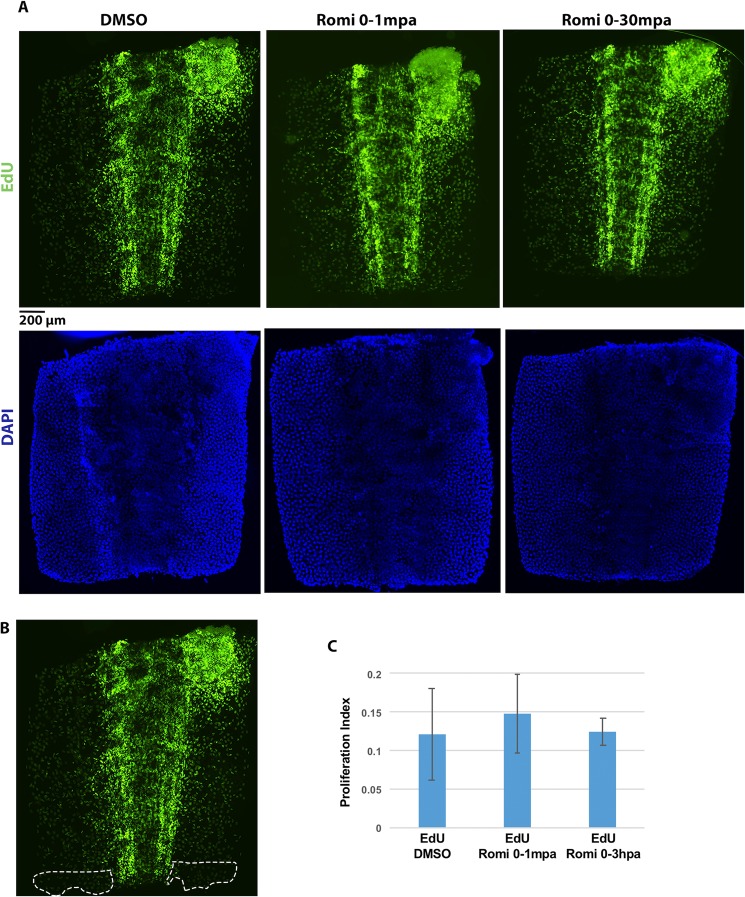
Figure 5.
Romidepsin treatment does not affect cell proliferation at 3 hpa. (A) Embryo tail images showing EdU and DAPI staining at 3 hpa for control (DMSO) and treatment groups (Romi 0–1 mpa, and Rmoi 0–3 hpa). Scale bar = 200 μ. (B) Representative image for the 200 μ area of the tail tip used for cell counts and calculations. (C) EdU quantification for embryos treated with DMSO (N = 6) and Romidepsin for 0–1mpa (N = 6) and 0–3 hpa (N = 6). Error bars are standard deviations of the mean.

