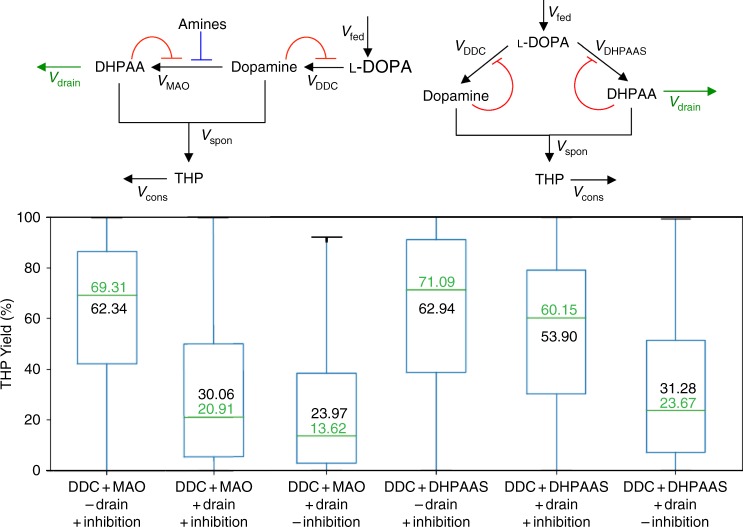
Fig. 2.
Predicted THP yields from DHPAAS- and MAO-mediated pathways. Conversion of L-DOPA to THP was simulated with and without DHPAA drain (green arrows), and also with and without product feedback inhibition (red flat-headed curves). The blue flat-headed line shows MAO inhibition by amines included in all MAO models. Green center lines show the median values (fiftieth percentile or second quartile), and the blue boxes contain the twenty-fifth percentile (first quartile) to seventy-fifth percentile (third quartile) of each dataset. The black whiskers show minimum and maximum values of each dataset. Median predicted THP yields are listed in green and mean predicted THP yields are listed in black within each box. All statistics were derived from n = 10,000 independent Monte–Carlo simulations

