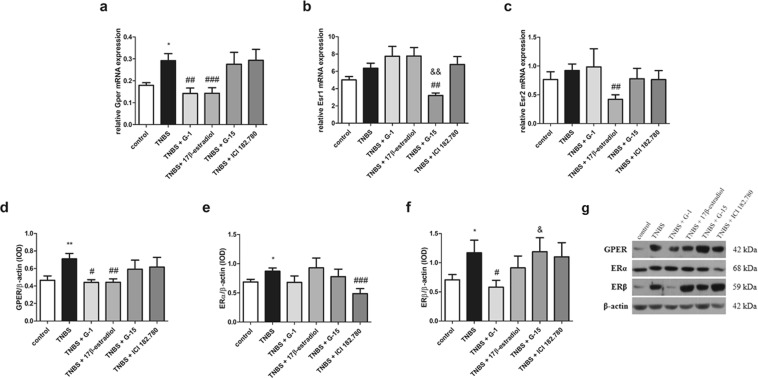
Figure 3.
Gper/GPER (a,d), Esr1/ERα (b,e) and Esr2/ERβ (c,f) expression at the mRNA (a–c) and protein level (d–f) and representative immunoblot of GPER, ERα and ERβ protein analysis (g) in colon section obtained from control, TNBS and treated groups. Data are presented as means ± SEM; *P < 0.05, **P < 0.01 TNBS vs. control; #P < 0.05, ##P < 0.01, ###P < 0.001 treated groups vs. TNBS; &P < 0.05, &&P < 0.01 G-15 treated group vs. G-1 treated group. 10–15 mice per group. Representative blots were cropped from the same gels.

