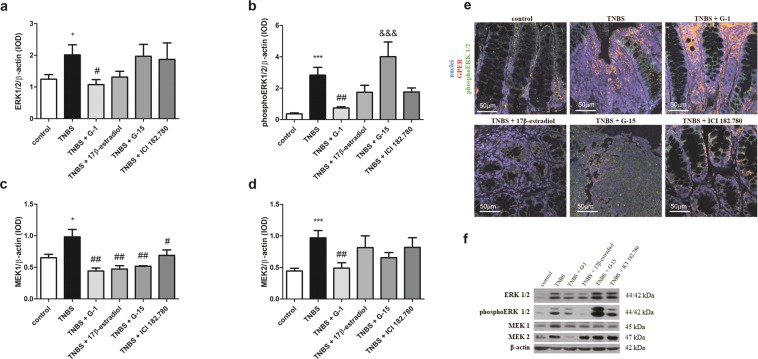
Figure 5.
ERK 1/2 (a), phosphoERK 1/2 (b), MEK 1 (c) and MEK 2 (d) protein level and representative immunoblot of ERK 1/2, phosphoERK 1/2, MEK 1 and MEK 2 protein analysis (f) in colon section obtained from control, TNBS and treated groups. Representative images of immunohistochemical staining of GPER and phosphoERK 1/2 (e) in colon cross-section obtained from control, TNBS and treated groups – type of treatment over each images are shown. Data are presented as means ± SEM; *P < 0.05, ***P < 0.001 TNBS vs. control; #P < 0.05, ##P < 0.01 treated groups vs. TNBS; &&&P < 0.001 G-15 treated group vs. G-1 treated group. 10–15 mice per group. Ten independent cross-section per group were examined. Scale bars, 50 µm. Representative blots were cropped from the same gels.

