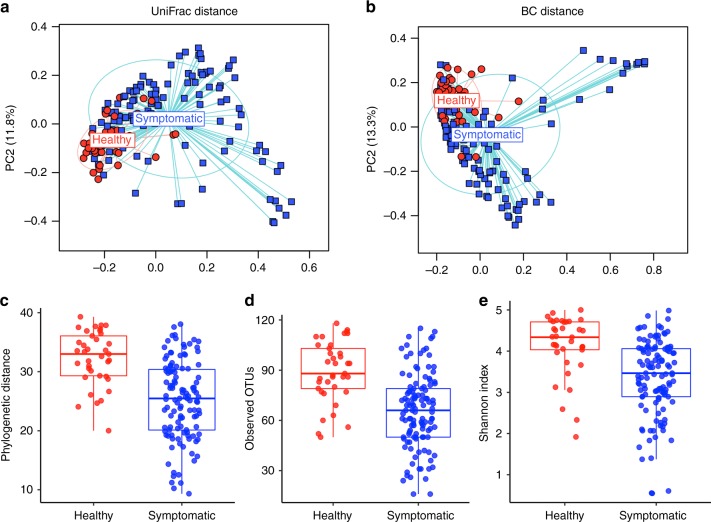
Fig. 1.
The duodenal microbiome is altered in patients with GI symptoms. Principal coordinate axis (PCoA) plot showing beta diversity of patients with GI symptoms (n = 126, blue) and healthy controls (n = 38, red) based on a unweighted UniFrac and b Bray–Curtis distances (p = 0.001, PERMANOVA). Alpha diversity (within subject) of patients with GI symptoms (n = 126, blue) and healthy controls (n = 38, red) based on c phylogenetic distance d observed OTUs and e Shannon diversity index metrics (rarefied to 5000 sequences; p < 0.0001, t test). Tukey boxplots show the median with IQR and 1.5 IQR whiskers

