Fig. 3.
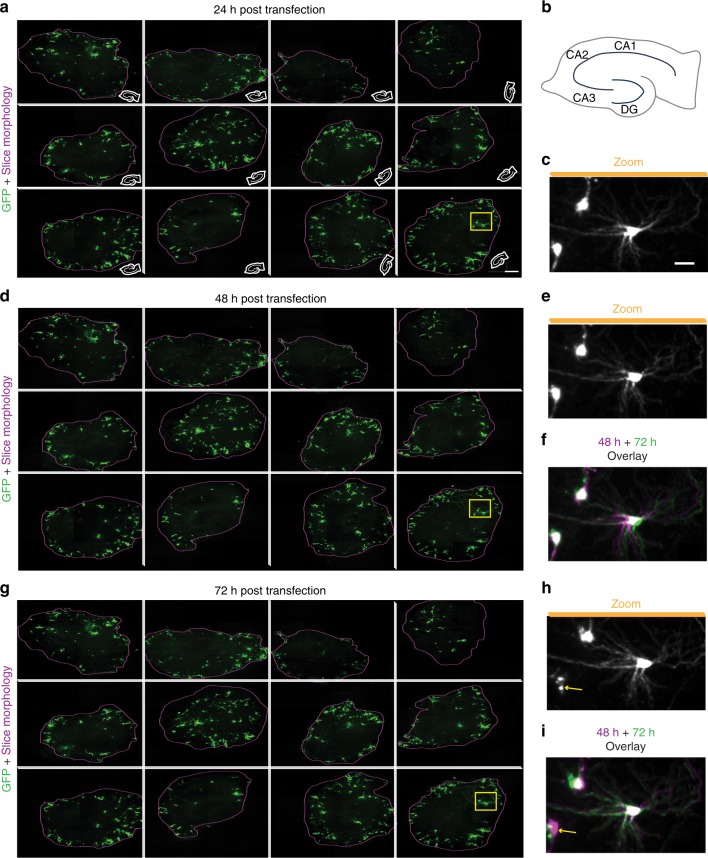
Longitudinal automated high-content, multiplexed imaging to detect changes within single neurons. a Maximum z-projections of 12 hippocampal slices transfected with EGFP and imaged with automation at high resolution 24 h post transfection (hpt) (left, scale bar 300 µm). Purple line represents edge of the slice. White cartoon inset shows the orientation of slice within the well. b Schematic of a hippocampal slice with locations of cornu ammonis (CA) 1, CA2, CA3, and dentate gyrus (DG) subregions. Miniaturised versions of same schematic were used in insets of a. c Magnification of three individual neurons within yellow box in a demonstrating high content of imaging approach. Scale = 50 μm. d Maximum z projections of the same 12 slices from a 48 hpt. e Expansion of same neurons within yellow box in c 48 hpt. f Overlay of imaging from 24 (magenta, same as c) and 48 hpt (green) showing differences in morphology over time. g Maximum z-projections of the same 12 slices from a and d 72 hpt. h Expanded view of yellow box in g. i Overlay of imaging 48 hpt (magenta, same as e) and 72 hpt (green) showing differences in morphology over time. Arrows indicate death of a neuron at 72 hpt that is present at 48 hpt

