Fig. 4.
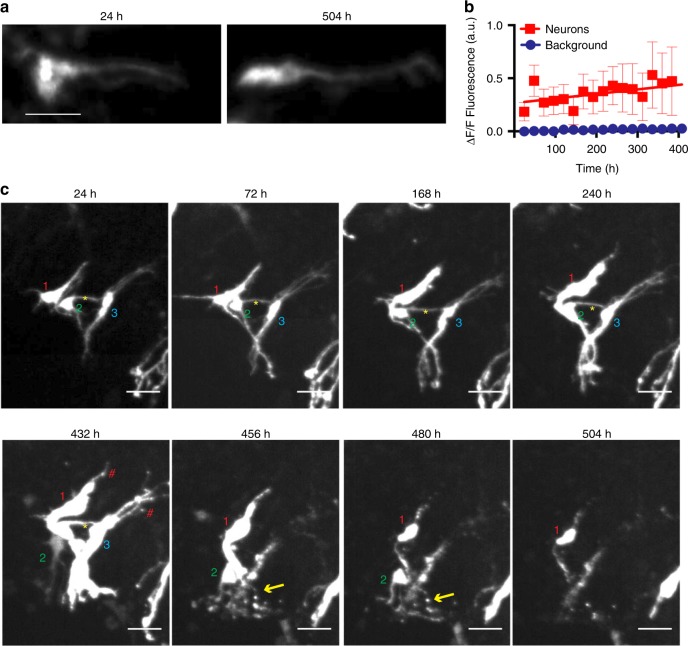
Complex changes in morphology preceding neuronal death revealed by longitudinal tracking of single cells in organotypic slice culture over weeks. a Maximum z-projections of a single EGFP-transfected neuron within a hippocampal slice culture imaged at 24 h post-transfection (hpt) (left) and 504 hpt (right) showing consistent EGFP signal. Scale = 40 μm. b Quantification of EGFP signal from single neurons (n = 12) imaged over 384 h showing increased EGFP signal over time. R2 = 0.8 SEMs are indicated. c Time-lapse time course of three neurons over 504 h showing changing morphology and neuronal death. Each neuron in a volume is labelled with a number (1–3) at the beginning of the experiment. When a cell dies, the software notes the event and the label disappears from the image. Yellow asterisks indicate apparent contacts between EGFP-labelled neurons. Red hashtags indicate areas of blebbing in unhealthy neurons. Yellow arrows indicate apparent neurite degeneration. Scale = 50 μm

