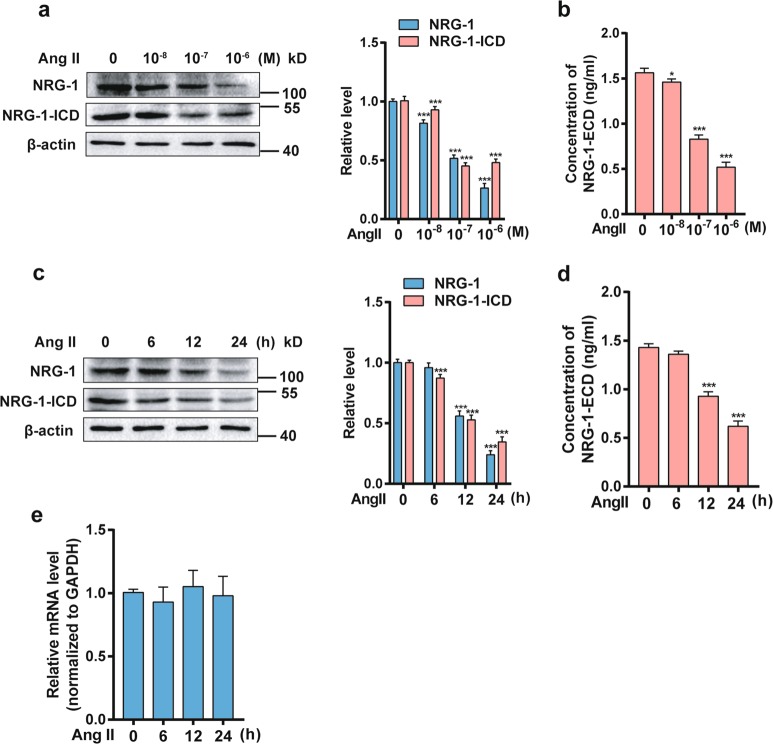
Fig. 1. NRG-1 is down-regulated in response to Ang II in MASMCs.
a NRG-1 and NRG-1-ICD expression levels in MASMCs treated with Ang II with different doses were analyzed by Western blot (left). The right panel shows densitometric analyses from three independent experiments. ***P < 0.001 vs. Ang II for 0 M. b Levels of NRG-1-ECD expression in the culture medium of MASMCs treated with different doses of Ang II were determined by ELISA. *P < 0.05, ***P < 0.001 vs. Ang II for 0 M. c Western blot was used to assess the NRG-1 and NRG-1-ICD expression levels in MASMCs treated with Ang II (10−7 M) for the indicated times (left). The right panel shows densitometric analyses from three independent experiments. ***P < 0.001 vs. Ang II for 0 h. d Levels of NRG-1-ECD expression in medium treated with Ang II (10−7 M) for the indicated times were analyzed by ELISA. ***P < 0.001 vs. Ang II for 0 h. e MASMCs were treated with Ang II (10−7 M) for the indicated times, and NRG-1 mRNA was detected by qRT-PCR. Data represent the means ± SEM of three independent experiments

