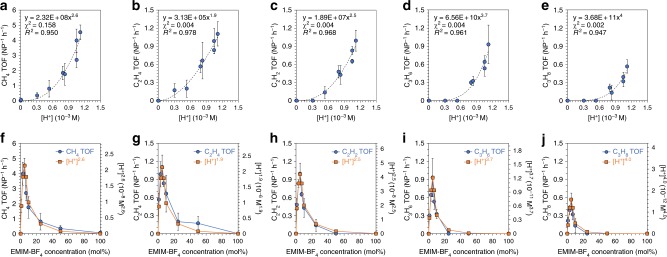
Fig. 4.
Empirical kinetic model for the CO2RR. a–e For each of the hydrocarbon products, the TOF is plotted as a function of the H+ concentration, [H+], which serves as a proxy for the concentration of the [EMIM*-CO2] complex. A fit to a power-law function y = axn (dashed line) yields the fit parameter n, which represents the apparent reaction order in [H+]. The best-fit equation is indicated for each plot along with the values of χ2 and R2, which serve as metrics of the goodness-of-fit. f–j For each hydrocarbon product, the TOF plotted as a function of the EMIM-BF4 concentration follows a similar trend as the [H+]n, where n is the corresponding reaction order obtained from the plots in a–e. Each data point in a–j is the average of results from three identical trials and the error bar represents the SD of these measurements

