Fig. 2.
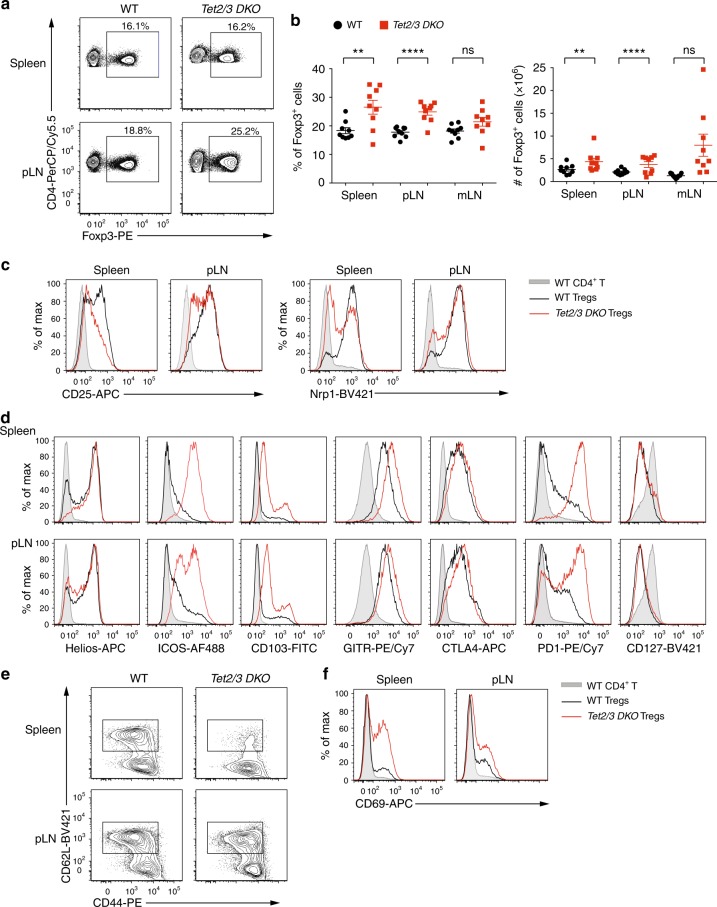
Characterization of Tet2/3-deficient Treg cells. a Representative flow cytometry analyses of the percentage of Treg cells (% of Foxp3+ cells in gated CD4+ T cells) in spleen and pLN from WT and Tet2/3fl/flFoxp3Cre DKO mice (13–16 weeks-old). b Quantification of the percentages (left panel) and cell numbers (right panel) of Treg cells in spleen, pLN and mLN from WT and Tet2/3fl/flFoxp3Cre DKO mice (13-16 weeks old, n = 9). c–f Flow cytometry analysis of Tet2/3-deficient Treg cells from spleen and pLN for the expression of CD25 and Nrp1 (c); Helios, ICOS, CD103, GITR, CTLA4, PD1 and CD127 (d); CD62L versus CD44 (e); and CD69 (f). Shown are WT CD4+ T cells (shaded gray); WT Tregs (black line); DKO Tregs (red line). Statistical analysis was performed using two-tailed unpaired student’s t test (*P < 0.05, **P < 0.01, ***P < 0.001, ****P < 0.0001). Error bars show mean ± s.d. from at least three independent experiments

