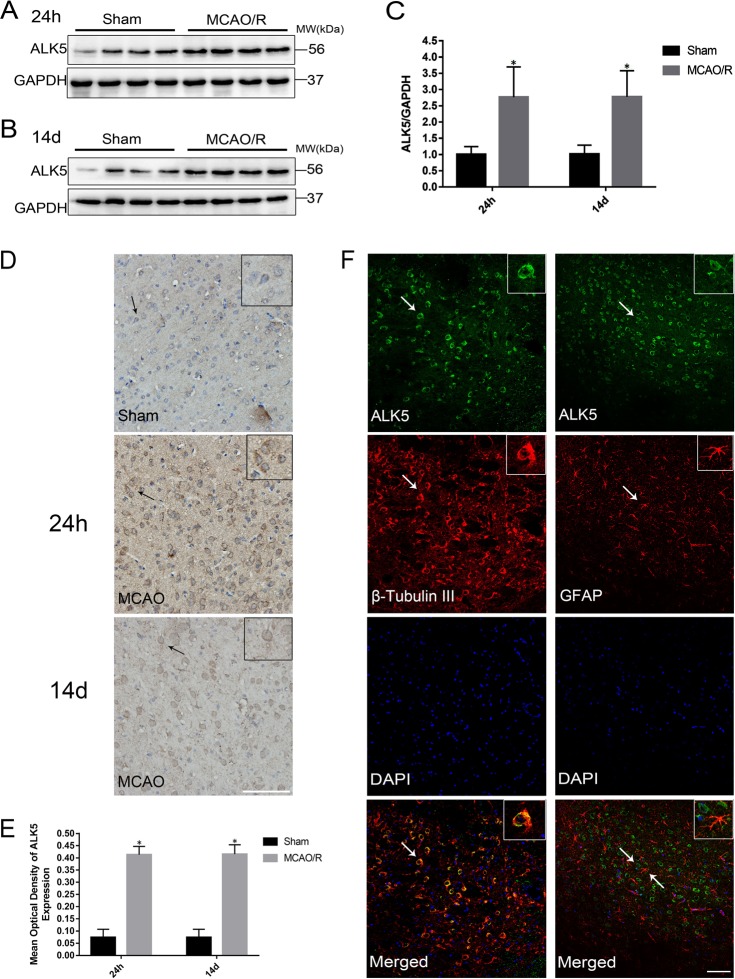
Fig. 1. ALK5 is increased in the ischemic hemisphere in a MCAO/R rat model.
a Representative images of ALK5 expression in the ischemic hemisphere 24 h after I/R (n = 6 biological replicates). b Representative images of ALK5 expression in the ischemic hemisphere at 14 d after I/R (n = 6 biological replicates). c Comparison of mean intensity ratios in Western blot analysis. d Representative images of immunohistochemical staining for ALK5 expression 24 h and 14 d after I/R (n = 5 biological replicates) (scale bar = 100 μm). e Comparison of the mean density value in immunohistochemical analysis for ALK5 expression. f Representative images of immunofluorescence staining for ALK5 (green), beta-III tubulin (red)/GFAP (red) and cellular nuclei (blue). (scale bar = 100 μm). Arrows show the positive cells, and the inserted images show magnified images of representative cells. *P < 0.05, compared to the sham group at the same time point (Student’s t test)

