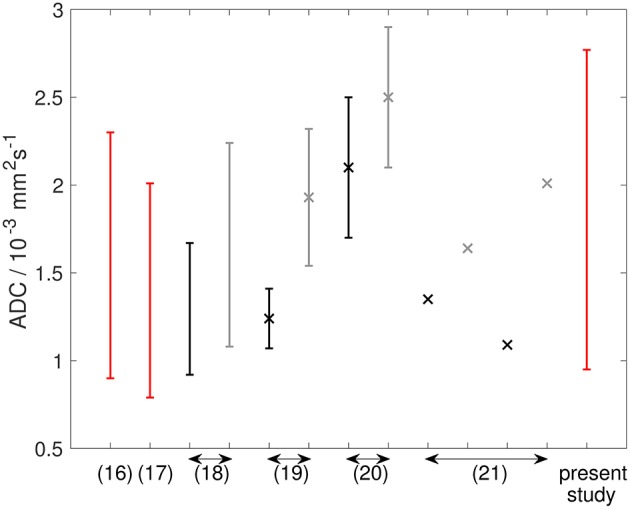
Figure 10.

Graph showing ADC data from the literature (described in Table 2), alongside data from the present study. References are shown on the x-axis. Double-headed arrows show multiple data points from the same reference. Red lines show ADC estimates from soft-tissue sarcomas at baseline. Black and gray lines show ADC estimates from osteosarcomas [and Ewing sarcomas in Hayashida et al. (21)] at baseline and post-treatment, respectively. Studies reporting mean ± standard deviation are shown as markers (×) with error bars representing standard deviation. Studies reporting only an average value are shown as markers (×) without error bars. Studies reporting a range are shown as error bars (upper and lower ends of range) without markers.
