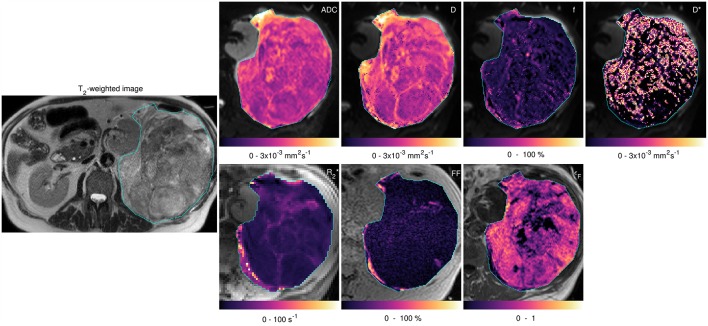
Figure 3.
Acquired images and fitted/calculated parameters from the same slice as Figure 2. Left-hand image: T2-weighted image showing ROI. Right-hand panels: fitted/calculated values in ROI (color) overlaid on acquired images (gray scale). Top row: ADC overlaid on b = 50 s mm−2 image; D, f, and D* overlaid on b = 50 s mm−2 images. Bottom row: overlaid on TE = 5 ms gradient-echo image; FF overlaid on in-phase image; εF overlaid on pre-contrast image.

