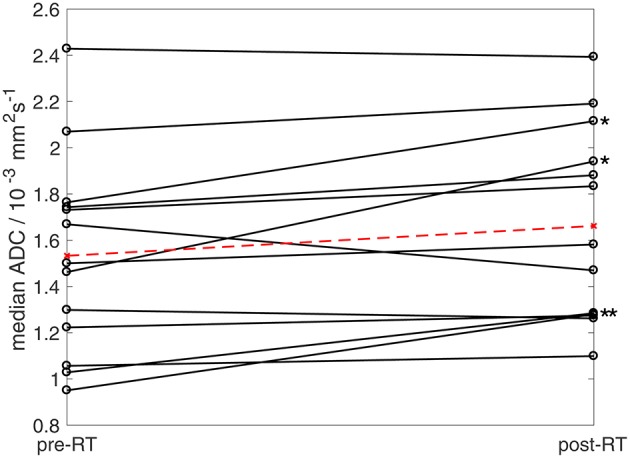
Figure 5.

Median ADC estimates pre- and post-radiotherapy. Ladder plot showing median ADC estimates for 13 patients pre- and post-radiotherapy (solid lines). In patients undergoing two baseline examinations, the mean of two estimates was used. Dashed line shows mean values for the cohort. Asterisks show four patients exhibiting post-treatment increases in median ADC outside baseline 95% LoA (One patient who underwent radiotherapy was excluded from ADC analysis as the tumor [well-differentiated liposarcoma] was composed of more than 80% fat and was therefore not evaluable using fat-suppressed diffusion-weighted imaging).
