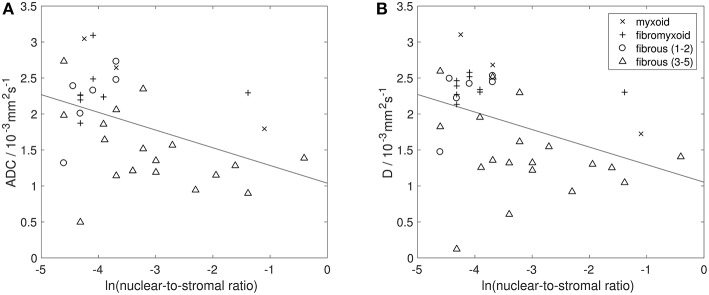
Figure 8.
Histopathological assessment of cellularity. Natural logarithm of nuclear-to-stromal ratio (estimated from histopathological analysis) vs. (A) apparent diffusion coefficient (ADC, estimated from DW-MRI) and (B) diffusion coefficient (D, from IVIM model of DW-MRI). Each point represents one ROI. Solid black line shows line of best fit. Points are labeled by histopathological assessment of stroma type (myxoid, fibromyxoid, or fibrous), with fibrous stroma types labeled by stroma grade (lower grades 1–2, and higher grades 3–5). ROIs that consisted of more than 80% fat were excluded from analysis of ADC and D.

