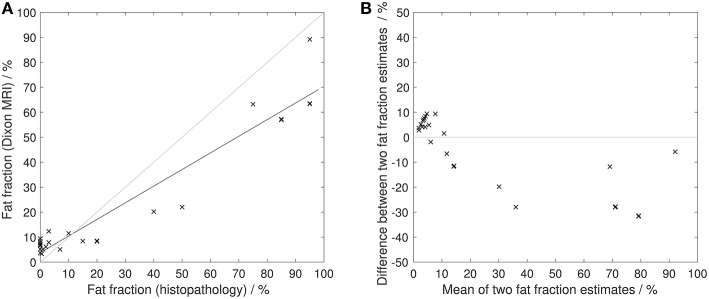
Figure 9.
Histopathological assessment of fat fraction. (A) Fat fraction estimated from Dixon MRI vs. fat fraction estimated from histopathological assessment. Solid black line shows line of best fit. Gray line shows line of identity. (B) Difference between fat fraction estimated from Dixon MRI and fat fraction estimated from histopathological assessment, plotted against the mean of the two measurements. Gray line shows line of no difference between two measurements.

