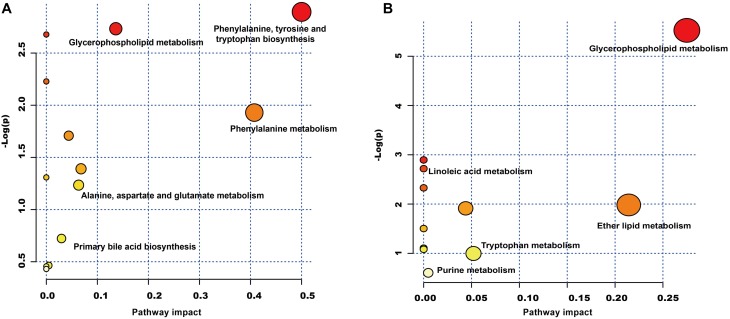
FIGURE 6.
Metabolic pathway analysis of the differential metabolites using the MetaboAnalyst 4.0. (A) Representative pathway analysis of the metabolites in leucopenia mice. (B) Representative pathway analysis of the metabolites in QJSB-treated mice. All the matched pathways are displayed as circles. The color and size of each circle was based on the P-value and pathway impact value, respectively. The smaller P-value means the pathway with higher levels of significance.

