FIGURE 9.

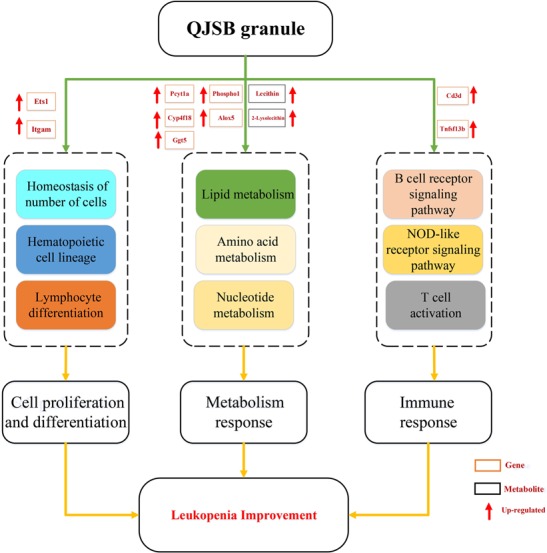
Multi-pathways treatment mechanism of QJSB on leucopenia in mice. The orange rectangle represents the key gene and the black rectangle represents the key metabolite. Red arrow represents up-regulated.

Multi-pathways treatment mechanism of QJSB on leucopenia in mice. The orange rectangle represents the key gene and the black rectangle represents the key metabolite. Red arrow represents up-regulated.