Figure 5.

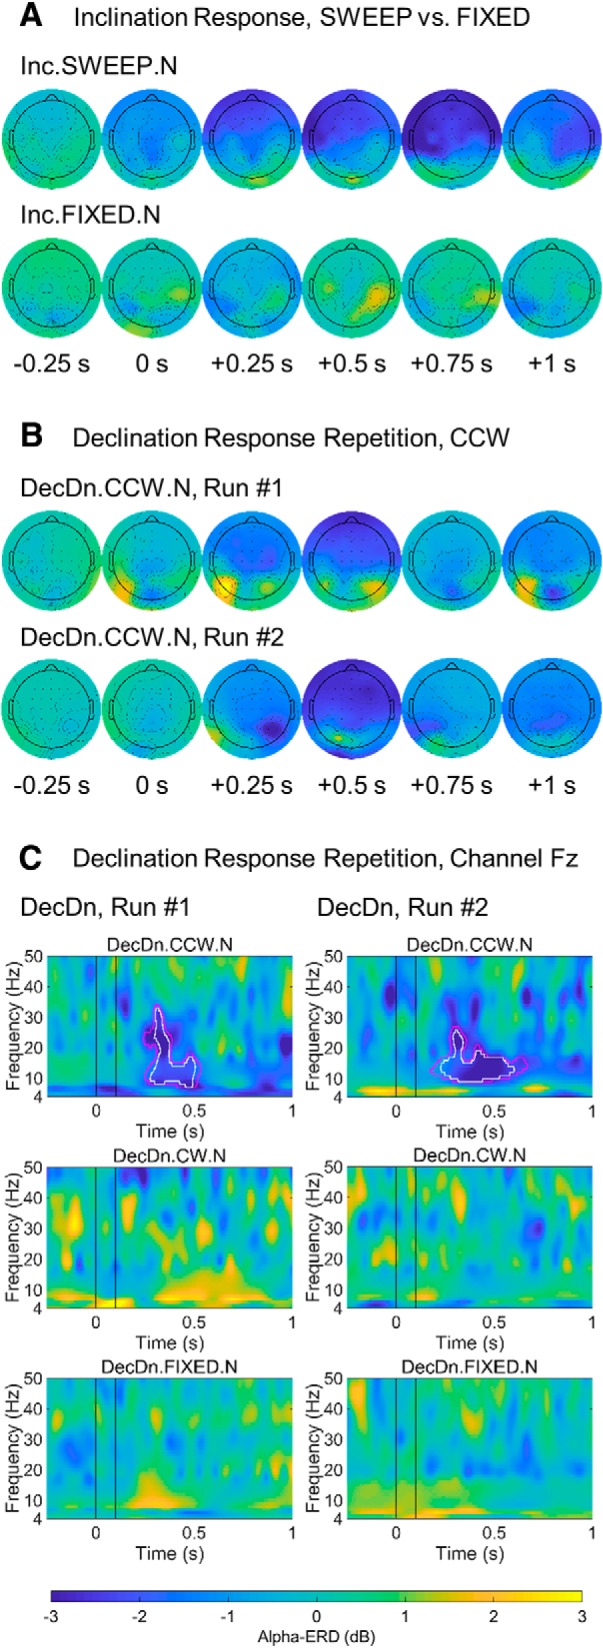
Alpha-ERD as a neural response to magnetic field rotation. Post-stimulus power changes (dB) from a pre-stimulus baseline (−500 to −250 ms) plotted according to the ±3-dB color bar at bottom. A, Scalp topography of the alpha-ERD response in an inclination experiment, showing alpha-power at select time points before and after field rotation at 0 s. Alpha-ERD (deep blue) was observed in SWEEP (top row), but not FIXED (bottom row), trials. B, Scalp topography of the alpha-ERD response for two runs of the declination experiment, tested six months apart in a different strongly-responding participant. DecDn.CCW.N condition is shown. In both runs, the response peaked around +500 ms post-stimulus and was widespread over frontal/central electrodes, demonstrating a stable and reproducible response pattern. C, Time-frequency maps at electrode Fz for the same runs shown in B. Black vertical lines indicate the 0- to 100-ms field rotation interval. Pink/white outlines indicate significant alpha-ERD at the p < 0.05 and p < 0.01 statistical thresholds, respectively. Separate runs shown side by side. Significant alpha-ERD was observed following downwards-directed counterclockwise rotations (outlines in top row) with no other power changes reaching significance. Significant power changes appear with similar timing and bandwidth, while activity outside the alpha-ERD response and activity in other conditions is inconsistent across runs.
