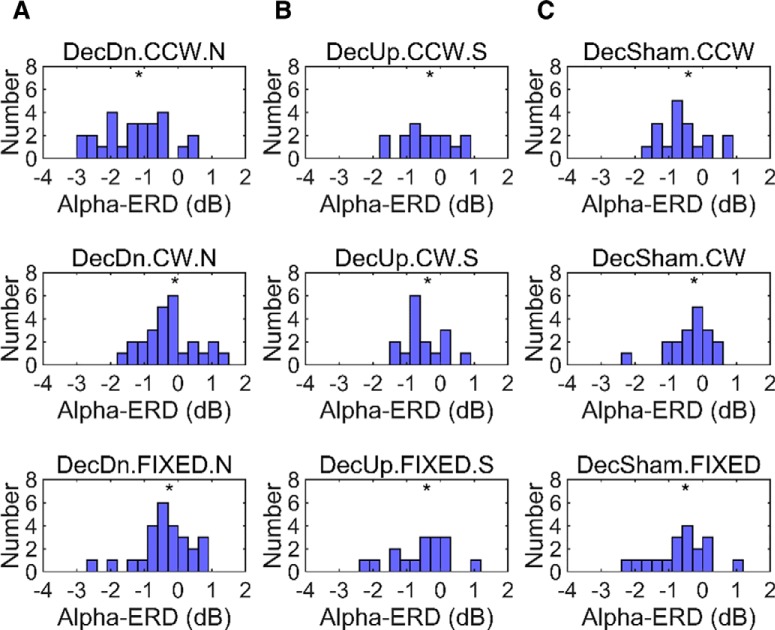
Figure 7.
Histogram of alpha-ERD responses over all participants. The panels show the histogram of individual responses for each condition. Frequency is given in number of participants. Because we looked for a drop in alpha-power following magnetic stimulation, the histograms are shifted toward negative values in all conditions. A, Standard DecDn experiment (N = 26). The CCW condition shows the most negative average in a continuous distribution of participant responses with the most participants having a >2-dB response. B, DecUp experiment (N = 16). No significant magnetosensory response was observed in any condition, and no clear difference is apparent between the three distributions. C, Sham declination experiment (N = 18). No significant magnetosensory response was observed in any condition, and no clear difference is apparent between the three distributions.

