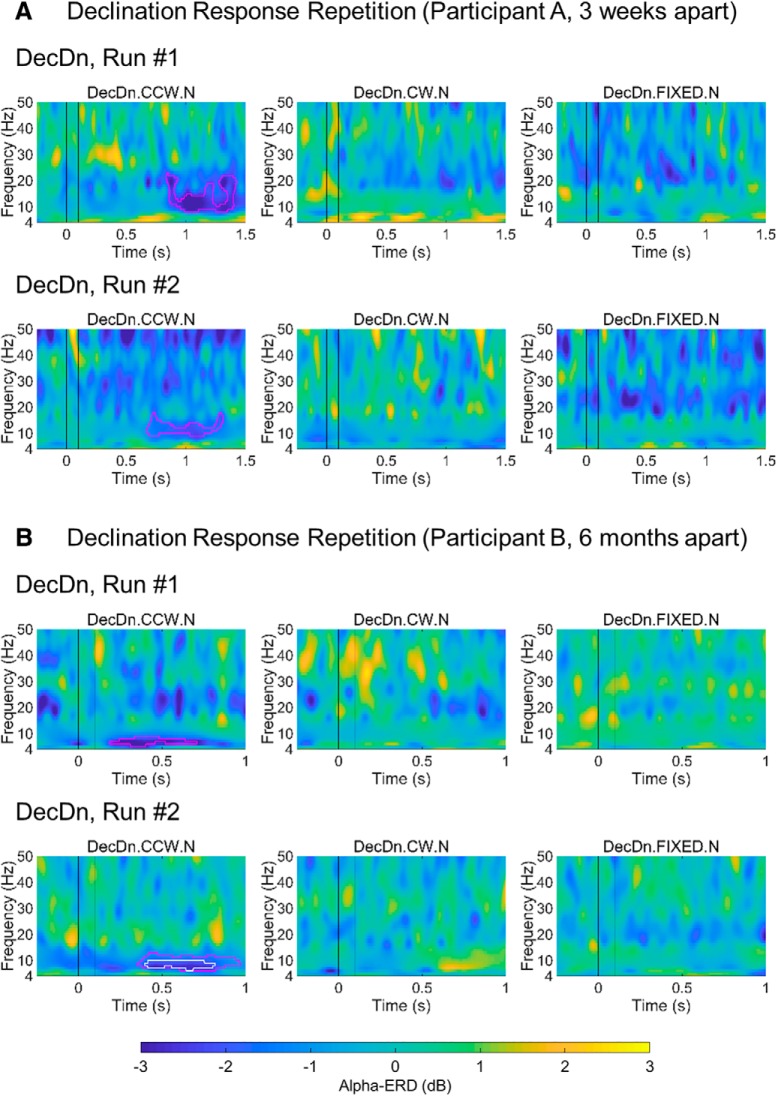
Figure 8.
Repeated results from two strongly-responding participants. In both A, B, participants were tested weeks or months apart under the same conditions (run 1 and run 2). Time/frequency maps show similar timing and bandwidth of significant alpha-power changes (blue clusters in outlines) after counterclockwise rotation, while activity outside the alpha-ERD response, and activity in other conditions is inconsistent across runs. Pink/white outlines indicate significance at the p < 0.05 and p < 0.01 thresholds. The participant in A had an alpha-peak frequency at >11 Hz and a lower-frequency alpha-ERD response. The participant in B had an alpha-peak frequency <9 Hz and a higher-frequency alpha-ERD response. Minor power fluctuations in the other conditions or in different frequency bands were not repeated across runs, indicating that only the alpha-ERD was a repeatable signature of magnetosensory processing.

