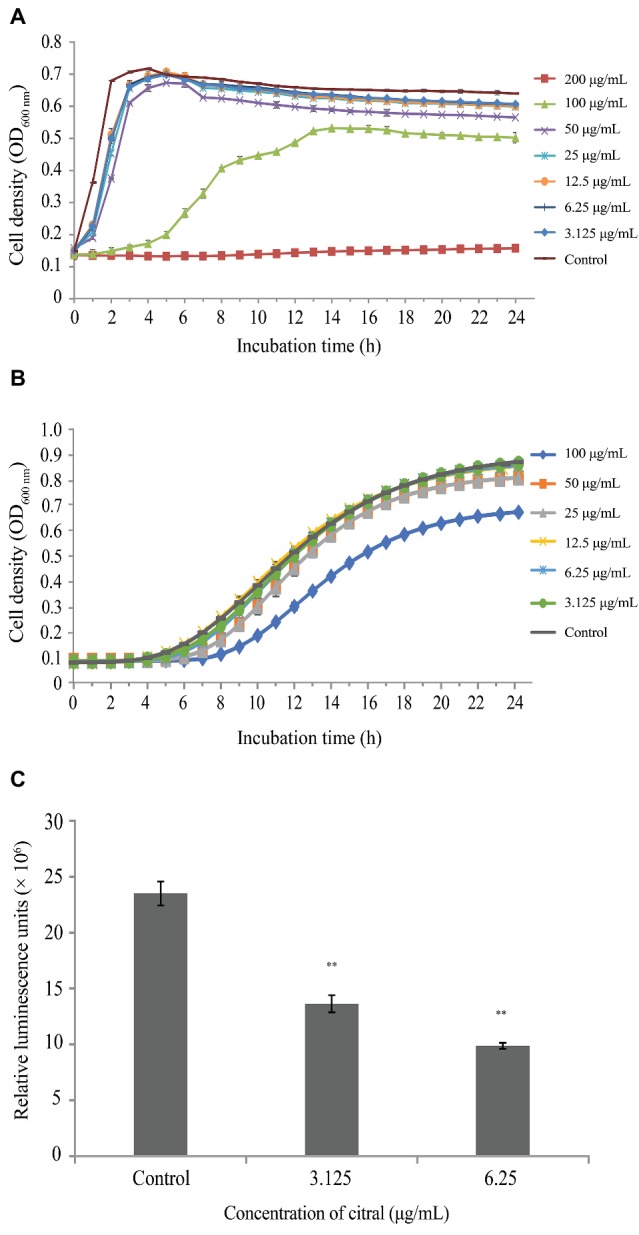
Figure 1.

(A) Growth of Vibrio parahaemolyticus ATCC 17802 treated with different concentrations of citral. Each value represents the average of three independent measurements. (B) Growth of Vibrio harveyi BB170 treated with different concentrations of citral. Each value represents the average of three independent measurements. (C) Inhibition of AI-2 production by Vibrio harveyi BB170 at sub-inhibitory concentrations of citral. Bars represent the standard deviation (n = 3). ** p ≤ 0.01.
