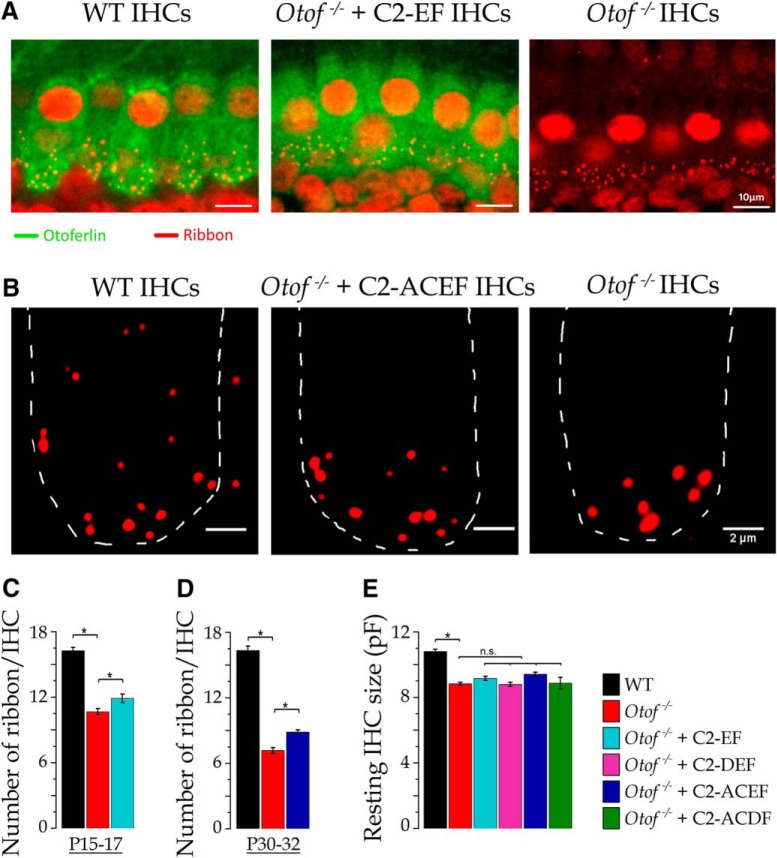
Figure 5.
Mini-Otof constructs partially rescued the synaptic ribbon numbers the synaptic ribbon numbers in Otof−/− IHCs. A, Using immunofluorescent confocal imaging, we quantified the number of synaptic ribbons (red dots) at P15–P17 in IHCs from WT, Otof−/− expressing the otoferlin C2-EF domain, and Otof−/− mice. The green signal indicates otoferlin expression in WT and C2-EF but not in noninjected Otof−/− IHCs. B, Immunolabeling examples of synaptic ribbons (at larger magnification; without otoferlin immunolabeling) in P30–P32 IHCs from a WT (control) mouse, an Otof−/− mouse injected with C2-ACEF, and a noninjected Otof−/− mouse. The dashed white line delineates the cell contour at the basal synaptic area of one IHC for each category. C, Comparative ribbon histogram at P15–P17 for C2-EF: IHCs of Otof−/− mice displayed a largely reduced number of ribbons (10.7 ± 0.3; n = 70 IHCs; 3 mice) compared with WT mice (16.2 ± 0.3, n = 40 IHCs, one-way ANOVA, p < 10−4). The Otof-C2-EF expression in Otof−/− IHCs had a significantly larger number of ribbons per cell (11.9 ± 0.4; n = 43 IHCs) compared with control, noninjected Otof−/− mice (10.7 ± 0.3; n = 70 IHCs; one-way ANOVA, p = 0.022). D, Comparative histograms at P30–P32 for C2-ACEF: IHCs of C2-ACEF-injected mice also displayed a significant preservation of synaptic ribbons (8.8 ± 0.2, n = 31 IHCs) compared with control, untreated Otof−/− mice (7.1 ± 0.3; n = 56 IHCs; Kruskal–Wallis, p = 1.8 10−3). E, The resting size of Otof−/− IHCs, measured in whole-cell recordings at −70 mV, was diminished compared to the WT IHC resting size (8.8 ± 0.09 pF, n = 53; 10.79 ± 0.14 pF, n = 43 respectively; one-way ANOVA, p < 10−4). None of the mini-Otofs significantly restored the resting size of IHCs. The asterisks indicate significantly different with p < 0.05 (for each compared to Otof−/− mice, one-way ANOVA). Error bars indicate SE.

