Figure 2.
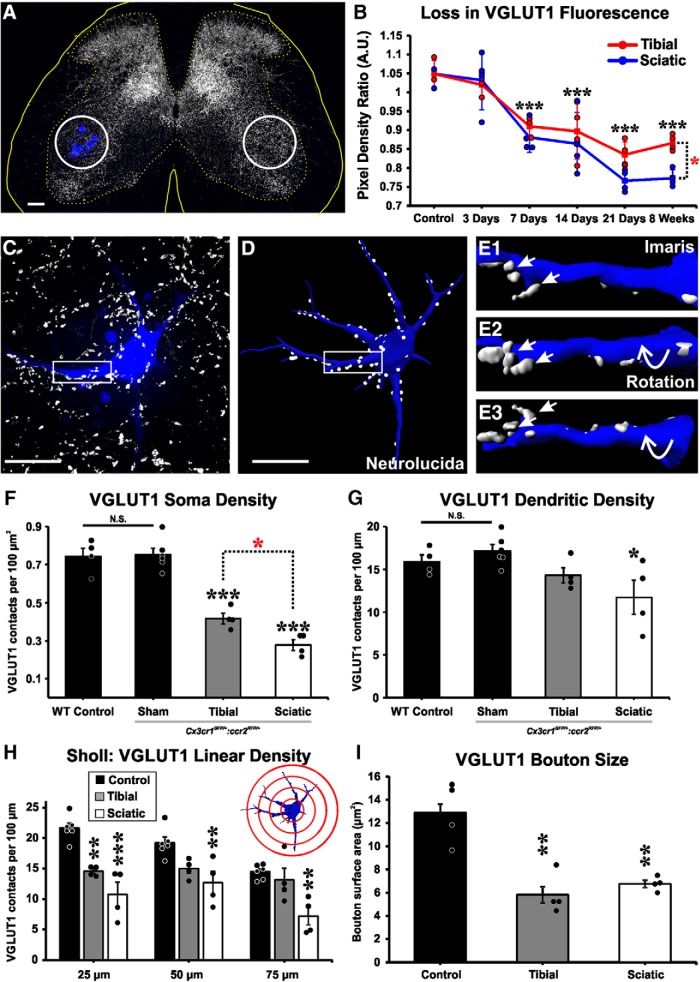
VGLUT1 synaptic loss after nerve injury. A, VGLUT1 immunoreactivity (IR) shows a unilateral decrease in the injured side around the region containing Fast Blue-axotomized LG MNs. ROIs (white circles) are placed on LG motor pools on both sides of the spinal cord, and the integrated pixel density of VGLUT1 immunofluorescence was measured. B, VGLUT1 immunofluorescence density changes with time. Data are presented as a ratio of estimates ipsilateral versus contralateral to the injury. VGLUT1 fluorescence decreases ipsilateral to the injury after sciatic (blue line) or tibial (red line) nerve cut-ligation injuries. y axis represents integrated pixel density ipsilateral/contralateral. Each dot represents estimates from 1 animal (n = 4 mice per time point per injury type). Lines indicate mean ± SE at each time point. Black asterisks are comparisons with control: ***p < 0.001. Red asterisk at 8 weeks is a comparison between injuries: *p < 0.05. C, High-magnification confocal image of a retrogradely labeled LG MN (blue, Fast Blue) from a sham control animal receiving VGLUT1 synaptic inputs (white). D, Neurolucida 3D reconstruction of the same MN with VGLUT1 contacts mapped along soma and dendrites. E1–E3, Imaris 3D surface renderings of dendritic segments shown in box highlighted in C, D. Rotations demonstrate VGLUT1 synapses attachment to the dendrite. F, D, VGLUT1 density in cell bodies and dendrites of dual-heterozygous sham control animals is not different from control MNs in WT animals. In dual-heterozygous animals, VGLUT1 densities are decreased in cell bodies both after either tibial or sciatic nerve transection compared with sham controls. Black asterisks are comparisons with sham: ***p < 0.001. Red asterisk compares the two injuries: *p < 0.05. Dendrite linear densities of VGLUT1 contacts are significantly decreased compared with sham controls only after sciatic nerve injury (black asterisk; *p < 0.05), but not after tibial nerve injury. H, Sholl analysis (bin size: 25 μm distance increments from cell body center): VGLUT1 densities compared with sham controls show significant decreases in the first 25 μm bin after both injuries, but at further distances depletions were significant only after sciatic nerve injury: ***p < 0.001; **p < 0.01. I, VGLUT1 bouton surface area is similarly reduced after tibial or sciatic nerve injury: **p < 0.01 to control. F–H, Error bars indicate mean ± SE (n = 4–6 mice); each mouse estimate is from 6 MNs per mouse. Scale bars: A, 100 μm; C, D, 50 μm.

